Versions
This documentation describes the 2.0.x branch.
Which branch to install
| Branch | Latest tag | Drupal | Status |
|---|---|---|---|
2.0.x |
2.0.0 | 10 and 11 | Current. Install this one. |
1.1.x |
1.1.1 | 10 and 11 | Fixes only. |
1.0.x |
1.0.11 | 10 and 11 | Superseded by 1.1.x. |
Every branch declares core_version_requirement: ^10 || ^11 and requires PHP 8.2 or newer.
Moving from 1.1.x to 2.0.0
The routes, the dashboard tabs and the menu links are byte-identical between 1.1.x and
2.0.0. Nothing in the interface moves. One setting does have to be set again, and the report
gains a section it did not have: both are described first below.
What changed:
- The report measures the overhead instead of estimating it.
1.1.xpublished a percentage summed from four hardcoded constants, printed as "Estimated overhead: 10%". No constant in it was measured, and the figure described no installation. That code is gone.2.0.0measures the module's own cost on the server it runs on, fromdrush no:overhead:measureor from Configuration > Development > Native Observability > Overhead measurement, and publishes the result with a label naming where the number came from. - The overhead section starts hidden after the upgrade, and that is deliberate.
native_observability_report_update_10102resets the publication state tohiddenon every existing site, so no site keeps publishing the old invented percentage. To show a figure again, either run a measurement and record it, or declare one by hand in the report settings. This is the one setting an administrator has to set again. - Anything that read the estimate directly is a breaking change.
ObservabilityImpactEstimator, theestimated_overhead_percentandimpact_levelconfig keys and thesections.overheadnarrative block are removed, with no replacement value to migrate to: the number they held was never measured. Sites that overrode the report message keys the overhead section used lose those overrides. - The configuration schema gained validation. Five capture keys now declare their allowed
values, so an imported configuration file with
client_ip_mode: inventedis rejected at import time instead of being stored. No existing valid value is affected. - The database observer report page shows 100 rows where it used to show 50.
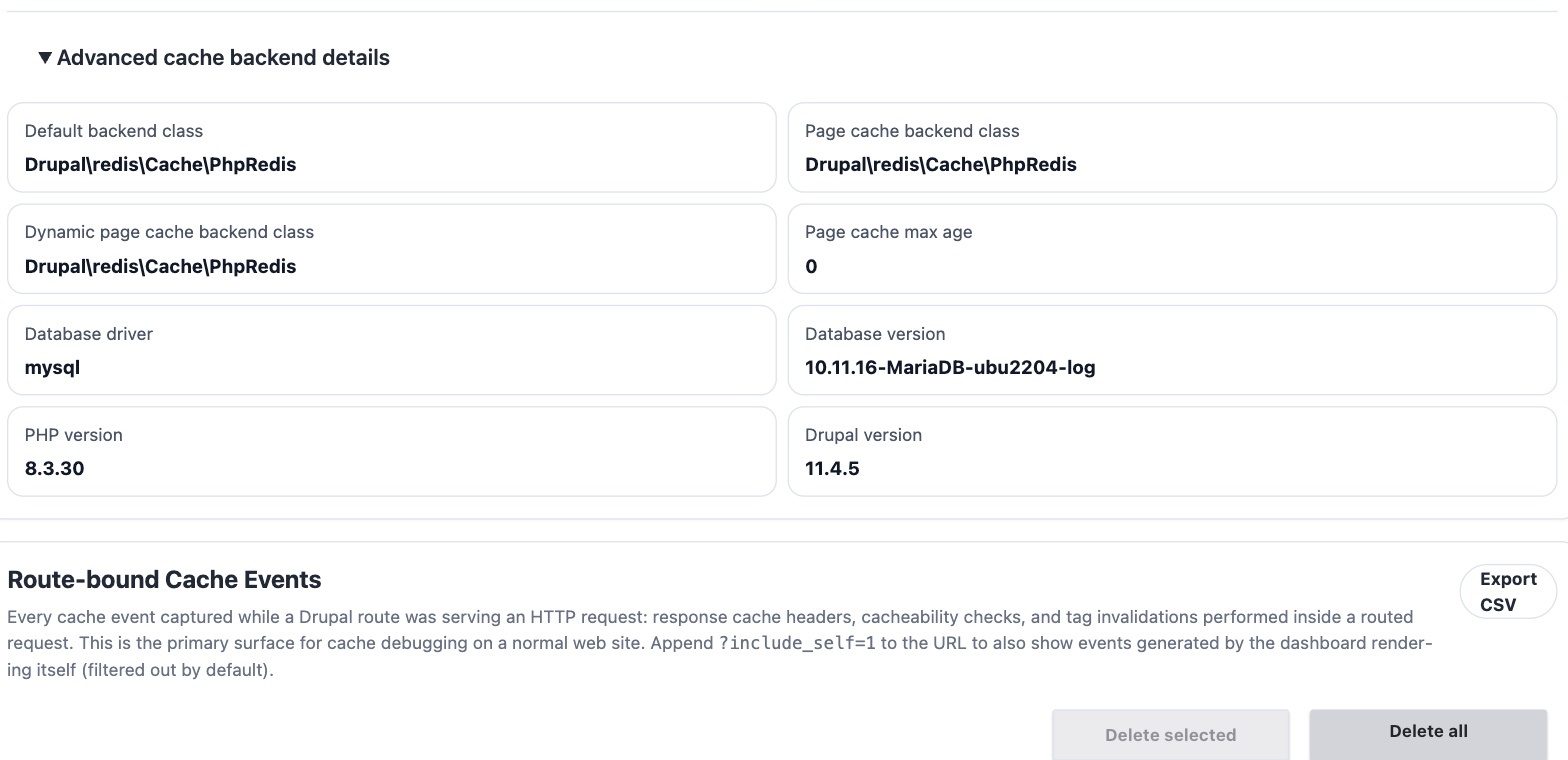
- A database without window functions is handled. The dashboard ranks endpoint samples with
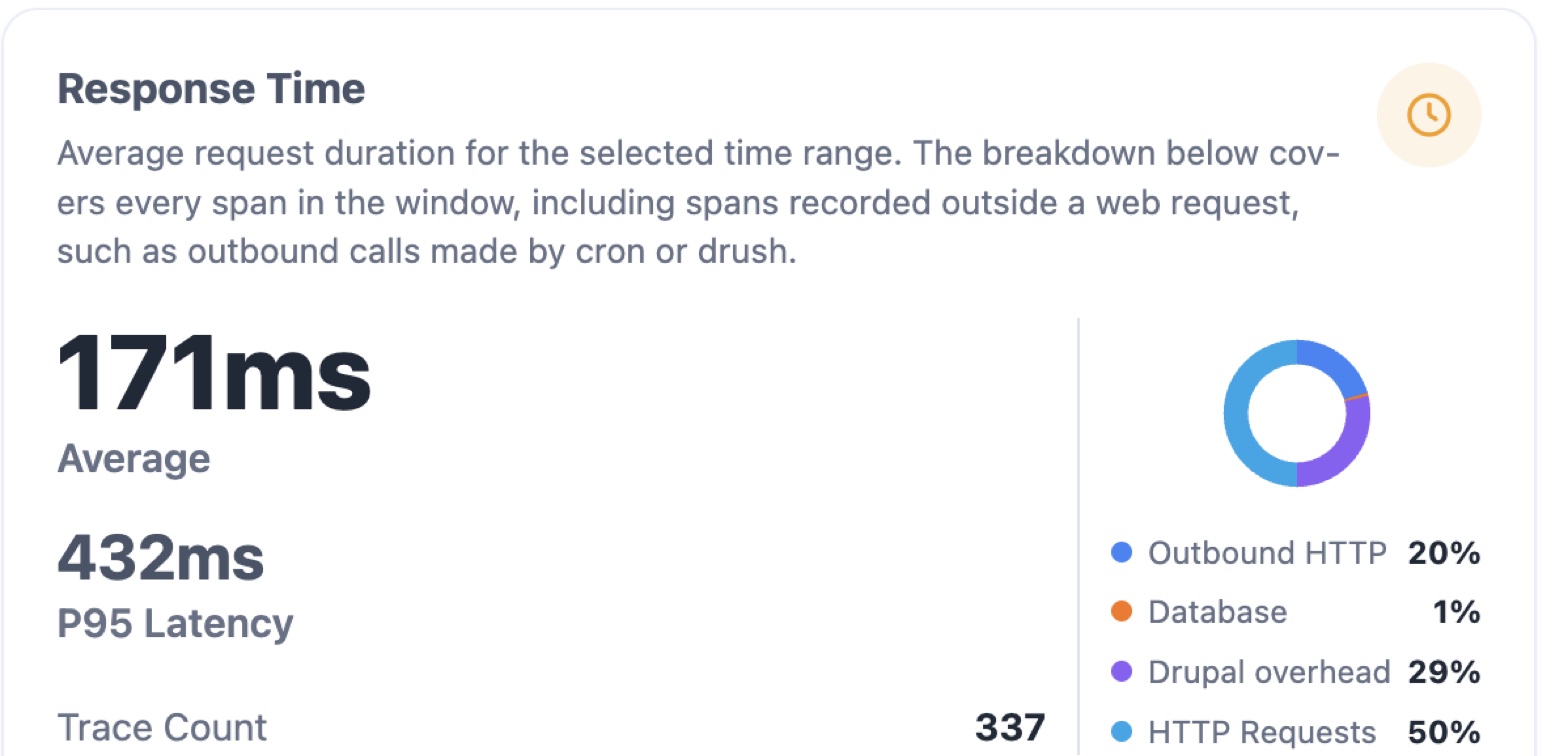
ROW_NUMBER() OVER (PARTITION BY ...). MySQL 5.7 has no window functions and Drupal 10 still allows it, so on that server the ranking moves to PHP and the status report says so. See Installation for the full list of database versions. - Spans recorded outside a web request stay visible. An outbound call made by cron or by drush has no request behind it. Those spans are still counted in the Response Time breakdown on the dashboard, which is how a command-line call shows up at all.
One break for module developers
ObservabilityCleanupHandlerInterface now declares timestampColumn(): string. A cleanup handler
outside this module has to implement it.
public function timestampColumn(): string {
  return 'created_at';
}
Return the literal column name your retention logic filters and orders by. Do not probe the schema for a set of candidate names and use whichever one exists: the handler and the table then disagree without anyone noticing, which is the failure this method exists to prevent.
Nothing else in the public API changed. A site that does not implement that interface has no work to do.
Upgrade path
composer require 'drupal/native_observability:^2.0'
drush updb -y
drush cr
The update hooks migrate configuration in place. Running drush updb a second time reports nothing
left to do.