Configuration
The sections below follow the order of the tabs on the settings pages:
Settings, Cleanup, Exclusions, Cache Observer, Database Observer,
OpenTelemetry, Report. Export settings come last because they are the one
settings form the tab strip does not link: reach them at
/admin/config/development/native-observability/settings/export.
Permissions
All permission machine names, titles, and descriptions below are read verbatim from each module's *.permissions.yml.
| Permission | Defined by | Unlocks |
|---|---|---|
access native observability |
native_observability |
View Native Observability status and diagnostics pages (/admin/reports/native-observability/status, /admin/reports/native-observability/sanity-check). |
view native observability traces |
native_observability |
View request traces, filter them, and export trace payload as JSON. |
administer native observability |
native_observability |
Configure what data Native Observability captures and stores (native_observability.settings form). |
administer native observability exclusions |
native_observability |
Manage request-log exclusion rules for Native Observability. |
delete all native observability traces |
native_observability |
Permanently delete all stored request traces. |
access native observability cache observer |
native_observability_cache_observer |
View raw cache observer events and exports. |
administer native observability cache observer |
native_observability_cache_observer |
Configure cache observer settings and delete retained cache observer data. |
access native observability dashboard |
native_observability_dashboard |
View the Native Observability dashboard and operational monitoring panels. |
access native observability database observer |
native_observability_database_observer |
View raw database observer records, details pages, and JSON exports. |
administer native observability database observer |
native_observability_database_observer |
Configure Database Observer settings and remove stored raw records. |
access native observability execution |
native_observability_execution |
View execution timelines and performance diagnostics. |
administer native observability export |
native_observability_export |
Manage scrape-side export settings (Prometheus, Elastic) for Native Observability. |
access native observability prometheus endpoint |
native_observability_export |
Access the Prometheus-compatible metrics endpoint exposed by Native Observability. |
view native observability metrics |
native_observability_metrics |
View aggregated route performance metrics, including throughput and latency percentiles. |
administer native observability otel |
native_observability_otel |
Manage OpenTelemetry exporter settings for Native Observability. |
Core settings
Two forms edit the core native_observability.settings configuration object.
Capture and retention settings
Form: native_observability.settings at /admin/config/development/native-observability/settings.
| Config key | Type | Default | Meaning |
|---|---|---|---|
capture.enabled |
boolean | true |
Master switch. When disabled, no traces are recorded. |
capture.request_id |
boolean | true |
Store the request ID field. |
capture.method |
boolean | true |
Store the HTTP method. Always true; the form checkbox is disabled (required by the storage schema for indexing). |
capture.path |
boolean | true |
Store the request path. Always true; the form checkbox is disabled (required by the storage schema for indexing). |
capture.route_name |
boolean | true |
Store the resolved Drupal route name. |
capture.status_code |
boolean | true |
Store the response HTTP status code. |
capture.duration_ms |
boolean | true |
Store request duration in milliseconds. |
capture.exception |
boolean | true |
Store exception class/message/code (best-effort). |
capture.store_uid |
boolean | true |
Store the acting Drupal user ID. |
capture.client_ip_mode |
string | anonymized |
Client IP capture mode: off, anonymized, hashed, or full. |
capture.client_ip_hash_salt |
string | '' |
Salt used when client_ip_mode is hashed. |
capture.user_agent_mode |
string | family |
User Agent capture mode: off, family, or full. |
capture.headers_mode |
string | off |
Request header capture mode: off or allowlist. |
capture.headers_allowlist |
sequence | {} |
Header names captured when headers_mode is allowlist. |
capture.query_mode |
string | off |
Query string capture mode: off, keys_only, allowlist, or full. |
capture.query_allowlist |
sequence | {} |
Query keys captured when query_mode is allowlist. |
capture.body_mode |
string | off |
Request body capture mode: off, keys_only, allowlist, or full. |
capture.body_allowlist |
sequence | {} |
Body keys captured when body_mode is allowlist. |
capture.exclude_own_routes |
boolean | true |
Skip requests to routes whose name starts with native_observability (dashboards, Prometheus endpoint, admin forms) so they never reach any storage this module family writes to (trace, spans, cache observer, database observer) or the OTLP exporter. |
retention.max_rows |
integer | 50000 |
Row cap enforced on each raw storage: traces, spans, cache events and database queries. Cleanup deletes the oldest rows above it, in cleanup_batch_limit batches. 0 means no cap. Route metrics are exempt, see below. |
What is stored about people, and how it is reduced
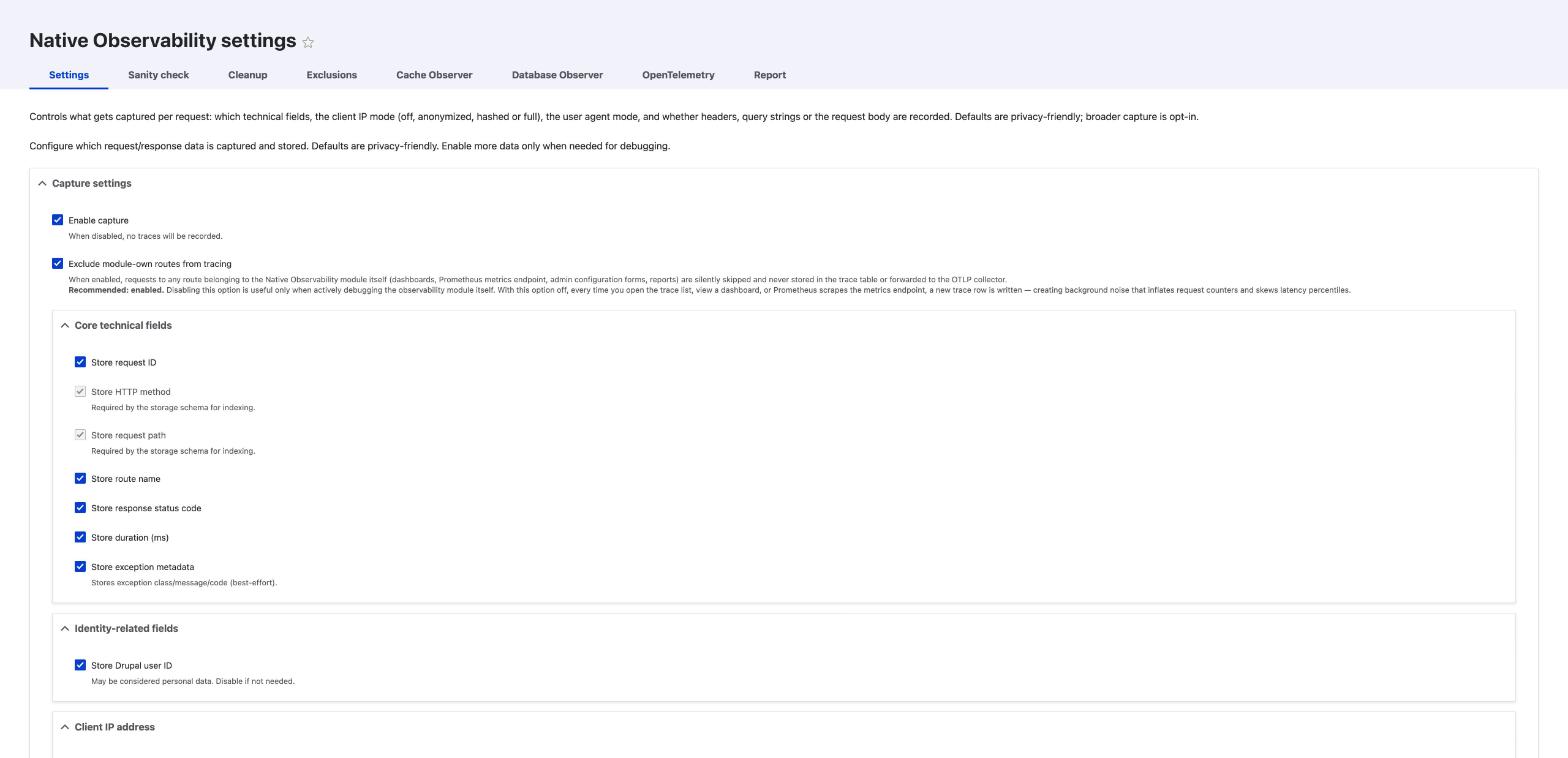
Every trace row can carry data that identifies a person: an IP address, a user agent, a Drupal user ID, query strings, headers, request bodies. The defaults are the privacy-preserving end of each setting, and broader capture is opt-in. This section states what each mode actually writes to the database, because "anonymized" on its own is not a commitment anyone can audit.
Client IP address
Setting: capture.client_ip_mode, default anonymized. Applied in
TraceSubscriber::anonymizeIp() and hashValue().
| Mode | What lands in the database | Example |
|---|---|---|
off |
Nothing. The column stays empty. | |
anonymized (default) |
IPv4: the last octet is replaced with 0. IPv6: only the first four blocks are kept, the rest is truncated to ::. |
203.0.113.47 becomes 203.0.113.0; 2001:db8:1:2:3:4:5:6 becomes 2001:db8:1:2:: |
hashed |
sha256(salt + "\|" + ip), using capture.client_ip_hash_salt. The original address is not recoverable, but the same address always produces the same hash, so sessions remain correlatable. |
64 hex characters |
full |
The address exactly as received. | 203.0.113.47 |
Two things follow from the implementation:
anonymizedkeeps a /24 for IPv4 and a /64 for IPv6. That is coarse enough to defeat identification of a single household in most cases, and precise enough to still identify a small office or a single-tenant network.hashedwith an empty salt is a plain SHA-256 of the address. The IPv4 space is small enough to brute-force exhaustively in minutes, so an empty salt gives close to no protection. Setcapture.client_ip_hash_saltto a long random value if you choose this mode.
User agent
Setting: capture.user_agent_mode, default family. Applied in
TraceSubscriber::userAgentFamily().
| Mode | What lands in the database |
|---|---|
off |
Nothing. |
family (default) |
A normalised browser and OS pair, matched on substrings of the lowercased agent (edge, chrome, safari, and so on, unknown when nothing matches). The version string, build numbers and device details are discarded. |
full |
The raw User-Agent header, which is often precise enough to fingerprint a device. |
User identity
Setting: capture.store_uid, default true. Stores the acting Drupal user ID
on the trace row. Turn it off when you do not need to attribute requests to
accounts; the form itself flags the field as potentially personal data.
Headers, query strings and request bodies
All three default to off, and all three are opt-in through an allowlist
rather than a blocklist. That direction matters: a field you forget to list is
not captured, instead of being captured until someone notices.
| Setting | Default | Modes |
|---|---|---|
capture.headers_mode |
off |
off, allowlist (names from capture.headers_allowlist) |
capture.query_mode |
off |
off, keys_only, allowlist (keys from capture.query_allowlist), full |
capture.body_mode |
off |
off, keys_only, allowlist (keys from capture.body_allowlist), full |
keys_only records which parameters were present without their values, which
answers "was a filter applied" without storing what was filtered on.
full captures credentials
query_mode: full and body_mode: full store the request verbatim,
including password fields, tokens in query strings, and any personal data
a form carried. Use them for short debugging sessions, and set them back
to off afterwards. Nothing redacts these values on the way in.
Retention is the other half
Reducing what is stored only limits exposure per row. retention.max_rows
(default 50000) bounds how many rows exist at once, trace_retention_hours
and the other per-storage windows in the cleanup settings bound how long rows
live. A privacy posture that sets every capture mode to its narrowest value
and leaves cleanup disabled still accumulates data indefinitely.
The row cap applies to the raw per-request storages: traces, spans, cache events and database queries. Route metrics are exempt on purpose. That table holds one row per route and time window, so its size follows the number of routes rather than the volume of traffic, and capping it would drop older aggregates instead of bounding an uncontrolled stream.
trace_retention_hours MUST NOT be shorter than spans_retention_hours,
native_observability_cache_observer.settings.retention_hours or
native_observability_database_observer.settings.retention_hours: spans,
cache events and database query rows reference a trace row, and a trace
purged ahead of the rows that point at it leaves those rows orphaned. Each
settings form validates this ordering on submit and rejects a combination
that would invert it, naming both the submitted and the conflicting value.
Cleanup settings
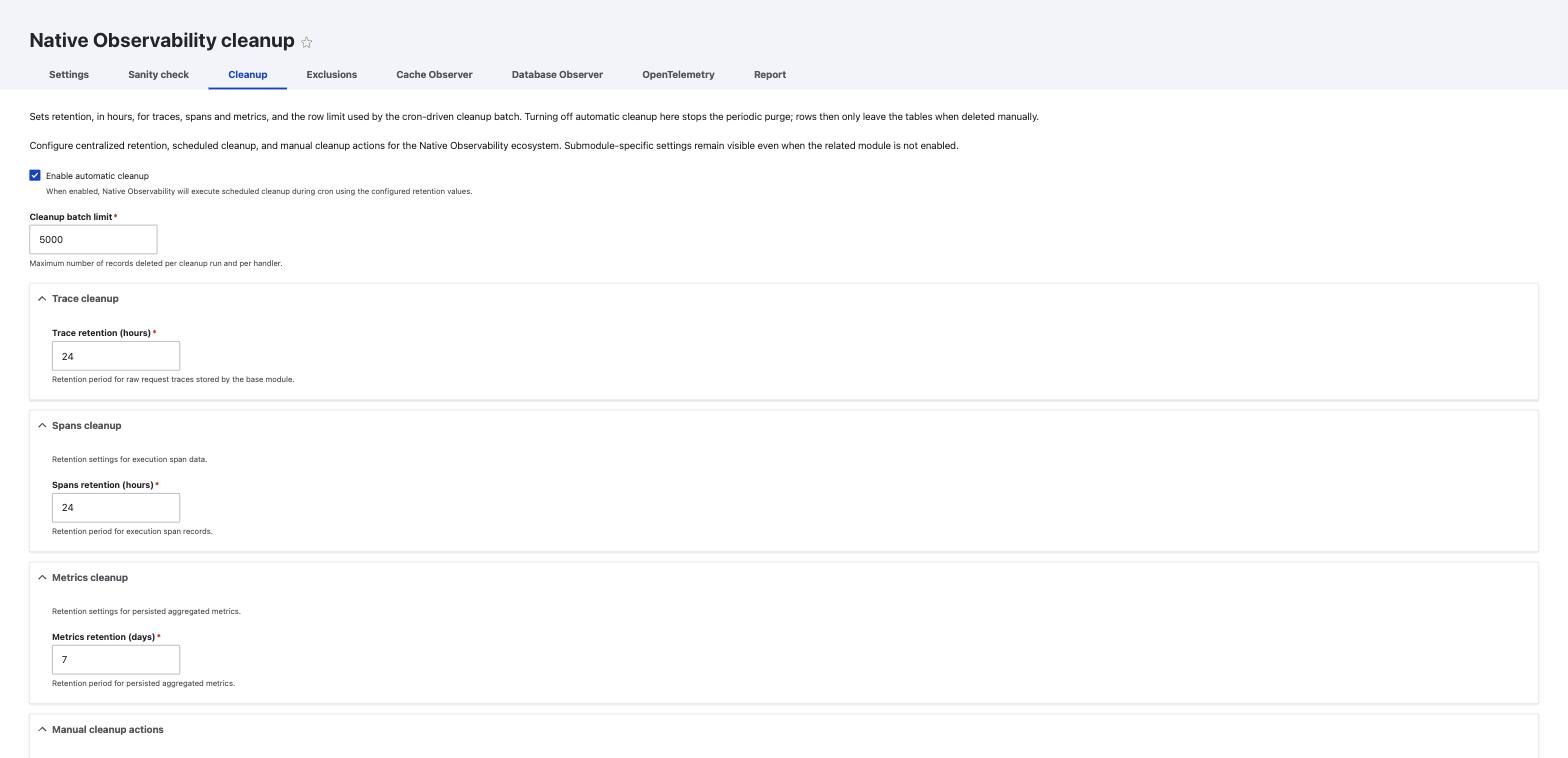
Form: native_observability.cleanup_settings at /admin/config/development/native-observability/cleanup. Requires the administer site configuration permission.
| Config key | Type | Default | Meaning |
|---|---|---|---|
cleanup_enabled |
boolean | true |
Enable the automatic cleanup routine for traces, spans, and metrics. |
trace_retention_hours |
integer | 72 |
Hours a trace row is kept before cleanup removes it. Must not be lower than spans_retention_hours, cache_observer.retention_hours or database_observer.retention_hours. |
spans_retention_hours |
integer | 24 |
Hours a span row is kept before cleanup removes it. |
metrics_retention_days |
integer | 7 |
Days an aggregated metrics row is kept before cleanup removes it. |
cleanup_batch_limit |
integer | 5000 |
Maximum number of rows deleted per cleanup batch run. |
deferred_persistence_enabled (boolean, default true) also lives in native_observability.settings but has no form element; it is set via configuration import or drush cset native_observability.settings deferred_persistence_enabled. When enabled, hot-path INSERTs (spans, observer events) are deferred to a single multi-row INSERT at kernel.terminate instead of one INSERT per event.
Excluding self-observability traffic
Once an external tool scrapes or polls this module, the module starts observing that traffic too. A Prometheus job on a 15 second interval adds 4 requests per minute forever, and every one of them is recorded as if it were application traffic. It inflates counters, skews latency percentiles, and fills the tables with rows that tell you nothing about your site.
Two separate mechanisms exclude that traffic. They do not cover the same channels, so knowing which is which matters.
The exclude_own_routes checkbox
capture.exclude_own_routes is a checkbox on
/admin/config/development/native-observability/settings, enabled by default.
It excludes any request whose route name starts with native_observability,
which covers the dashboards, the admin forms, the Prometheus scrape endpoint
and the Elastic export route.
RequestLogExclusionSubscriber decides this on kernel.request (and again on
kernel.exception, for a route whose access check fails before the first
check runs), setting the same request attribute an exclusion rule match sets.
Every observer that already asks RequestLogExclusionMatcher::isRequestExcluded()
picks it up unchanged, so the checkbox now stops these requests from reaching
the trace table, the OTLP exporter, the cache observer, the database observer
and the spans storage alike.
One channel is out of its reach: a request that Drupal's Internal Page Cache
serves as a HIT never runs the routing or request/response event pipeline
at all, so there is no route name available to check and no observer code
path runs either. CachePageObserverMiddleware, which reads the Internal
Page Cache's own outcome header, is the one place this can still be seen; a
HIT on one of this module's own routes is possible only if that route ever
serves a genuinely cacheable, anonymous response, which none of the current
routes do. Exclusion rules have the identical limitation for the same reason,
so this is not a regression introduced by fixing the checkbox.
Turn the checkbox off only while debugging the module's own runtime behaviour, and turn it back on afterwards.
Request log exclusion rules
Rules live at /admin/config/development/native-observability/exclusions and
are managed from a list with add, edit and delete operations. A matching rule
sets the native_observability.request_excluded request attribute, which
RequestLogExclusionMatcher::isRequestExcluded() reports to every observer
that asks. Changing a rule invalidates a runtime cache, so the list is rebuilt
on the next request.
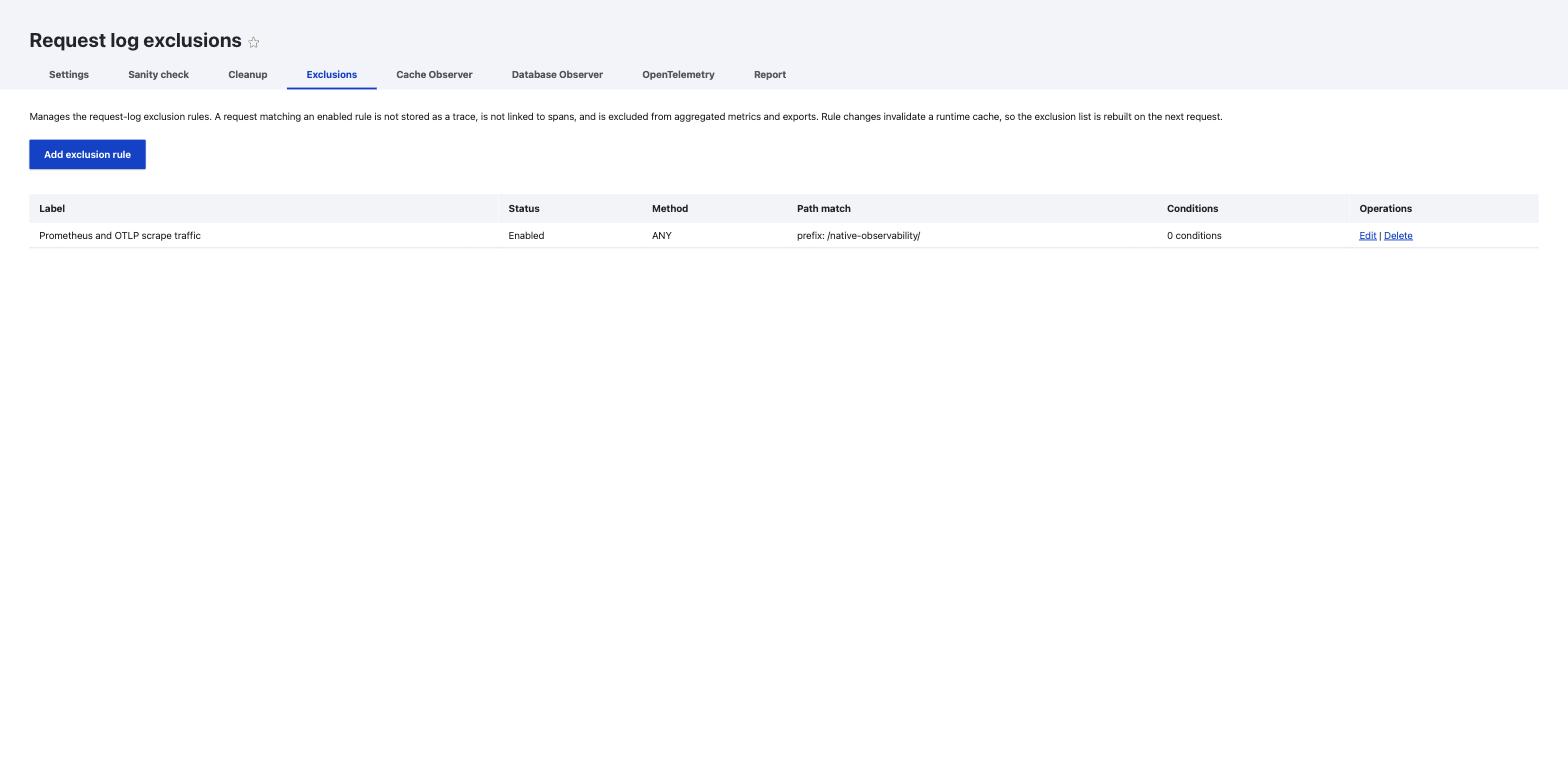
A rule has seven fields:
| Field | Required | Values | Meaning |
|---|---|---|---|
| Label | yes | free text | Name shown in the list. Not matched against anything. |
| Enabled | no | checkbox | A disabled rule is kept but ignored. |
| HTTP method | yes | ANY, GET, POST, PUT, PATCH, DELETE, HEAD, OPTIONS |
Restricts the rule to one method. ANY matches all. |
| Path match type | yes | exact, prefix, regex |
How Path pattern is compared to the request path. |
| Path pattern | yes | e.g. /foo/bar, /reports/, @^/reports/.*$@ |
The path to match. Regex patterns carry their own delimiters. |
| Query conditions | no | one per line | Further narrowing, see below. All conditions must match. |
| Notes | no | free text | For whoever reads the rule later. Write down why it exists. |
Query conditions use key|operator|value, one per line. Supported operators
are exists, missing, equals, regex, gte, lte and between, and
between takes two values: from|between|2026-01-01|2026-01-31.
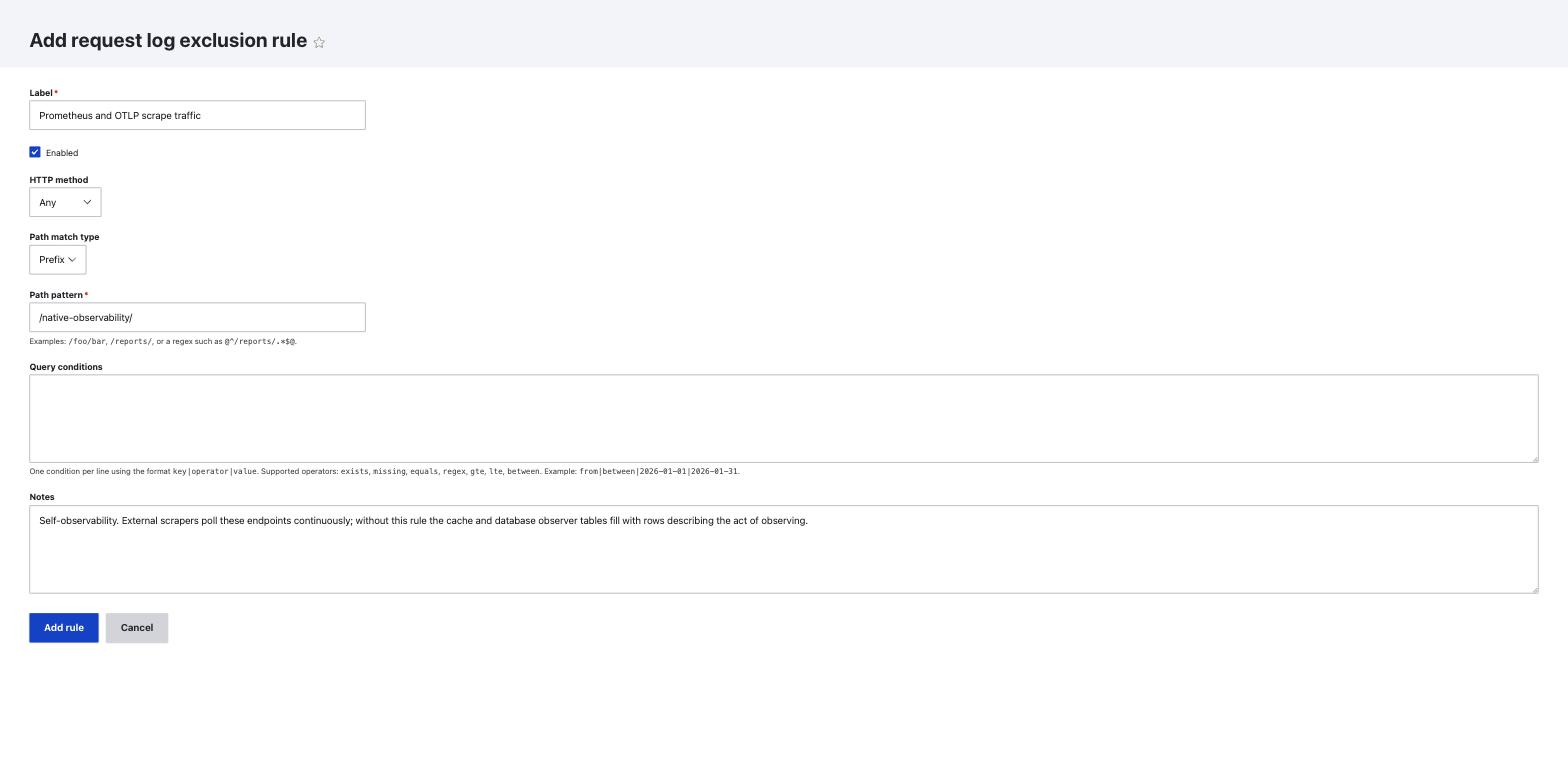
Use rules for traffic the checkbox cannot describe: a monitoring probe on a custom path, a health check, a cron endpoint, an integration that polls a route belonging to another module.
What each mechanism actually covers
Both mechanisms now reach every storage this module family writes to:
| Storage | Honours exclude_own_routes |
Honours exclusion rules |
|---|---|---|
native_observability_trace |
Yes | Yes |
| OTLP export | Yes | Yes |
native_observability_cache_event |
Yes | Yes |
native_observability_database_query |
Yes | Yes |
native_observability_spans |
Yes | Yes |
The checkbox only ever matches this module's own route names; keep using exclusion rules for everything else, as above.
Cache observer settings
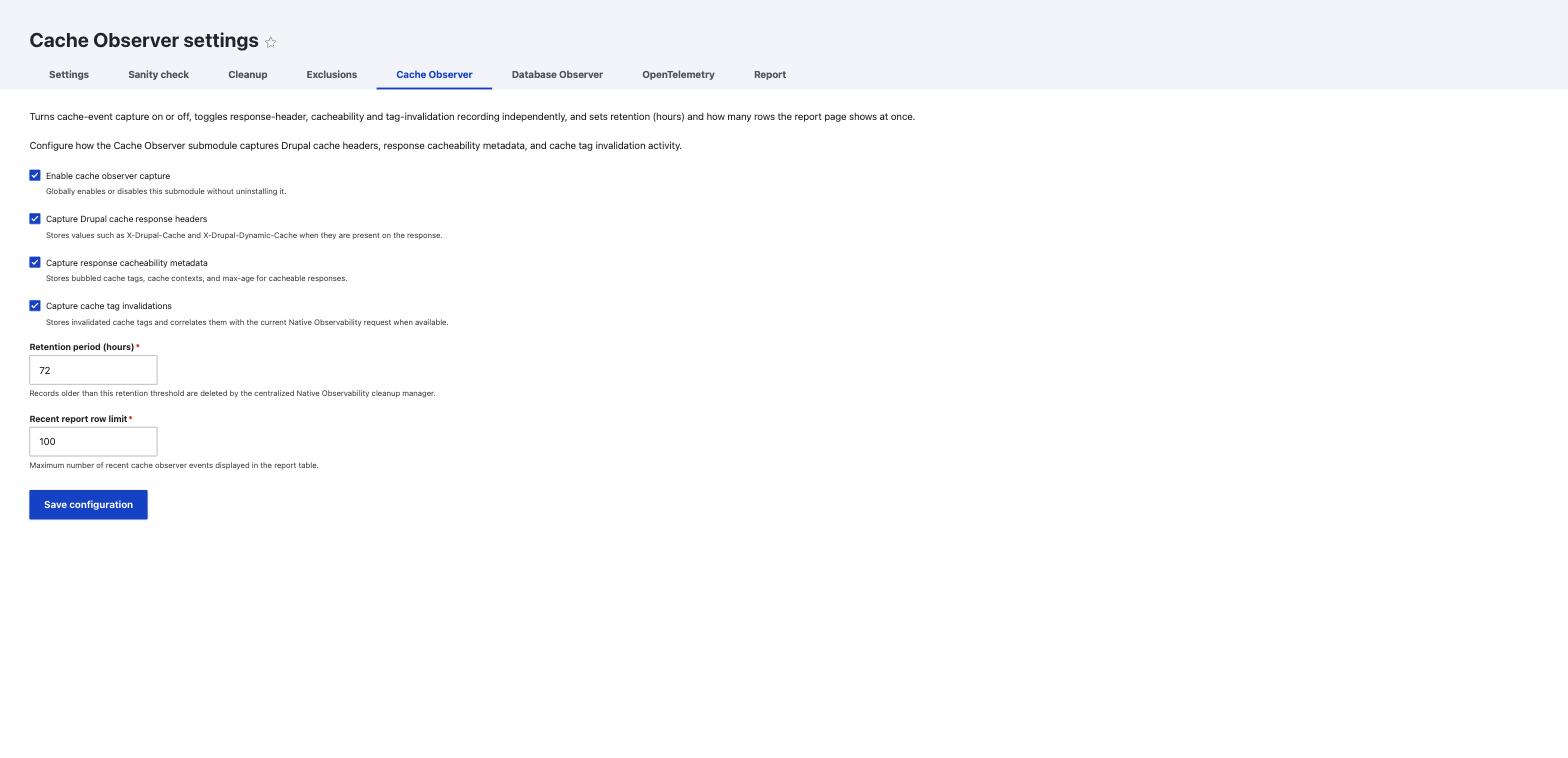
Form: native_observability_cache_observer.settings at /admin/config/development/native-observability/settings/cache-observer.
| Config key | Type | Default | Meaning |
|---|---|---|---|
capture_enabled |
boolean | true |
Enable cache observer capture. |
capture_response_headers |
boolean | true |
Capture Drupal cache response headers. |
capture_response_cacheability |
boolean | true |
Capture response cacheability metadata. |
capture_tag_invalidations |
boolean | true |
Capture cache tag invalidation events. |
retention_hours |
integer | 72 |
Hours a cache observer record is retained. |
report_limit |
integer | 100 |
Maximum number of rows shown in the cache observer report. |
Database observer settings
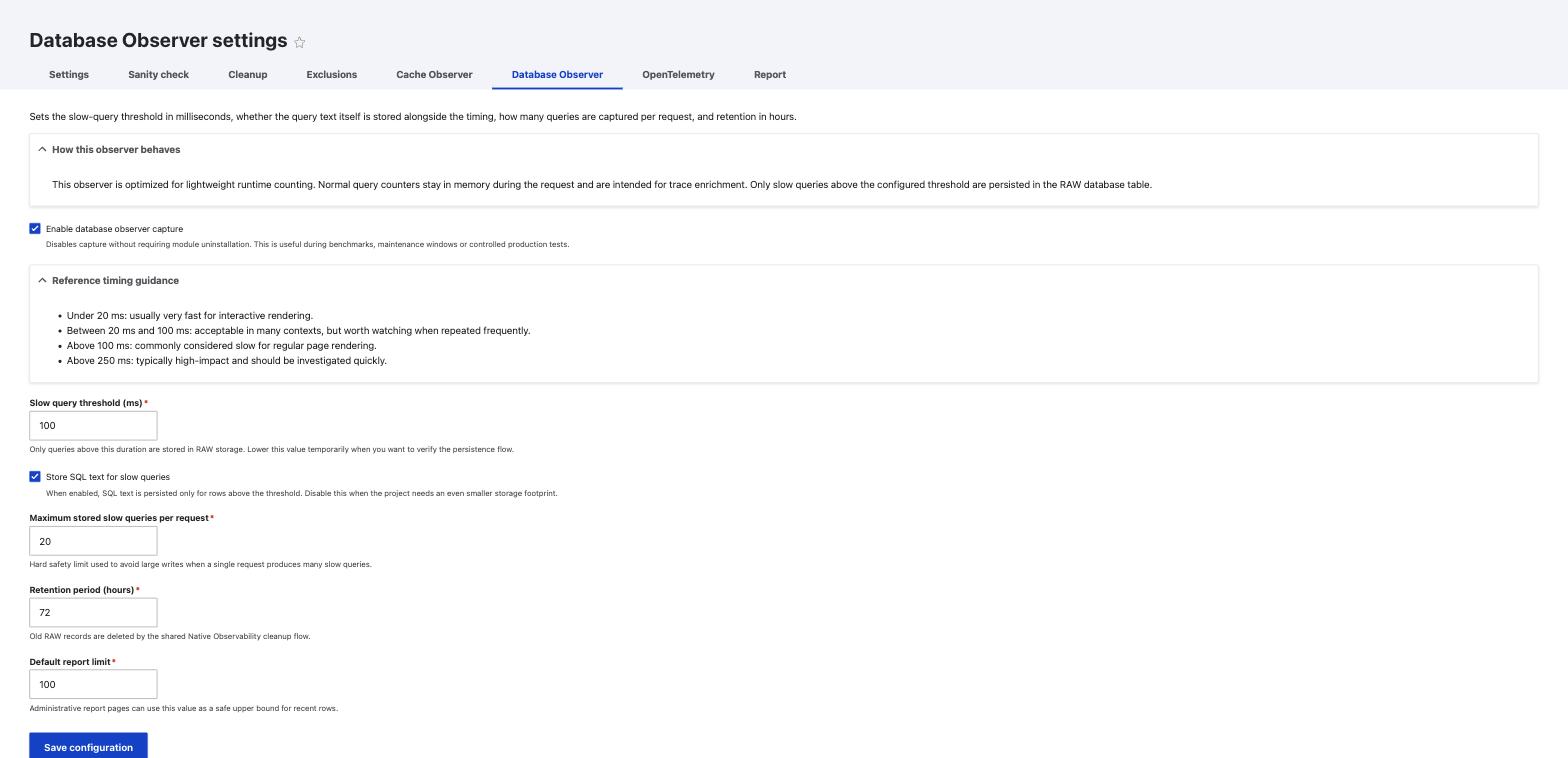
Form: native_observability_database_observer.settings at /admin/config/development/native-observability/settings/database-observer.
| Config key | Type | Default | Meaning |
|---|---|---|---|
capture_enabled |
boolean | true |
Enable database observer capture. |
slow_query_threshold_ms |
integer | 100 |
Minimum query duration, in milliseconds, to be recorded as slow. |
store_slow_query_text |
boolean | true |
Store the SQL text for queries above the threshold. |
max_stored_queries_per_request |
integer | 20 |
Maximum number of raw query rows stored per request. |
retention_hours |
integer | 72 |
Hours a database observer record is retained. |
report_limit |
integer | 100 |
Default maximum number of rows shown in the database observer report. |
OpenTelemetry settings
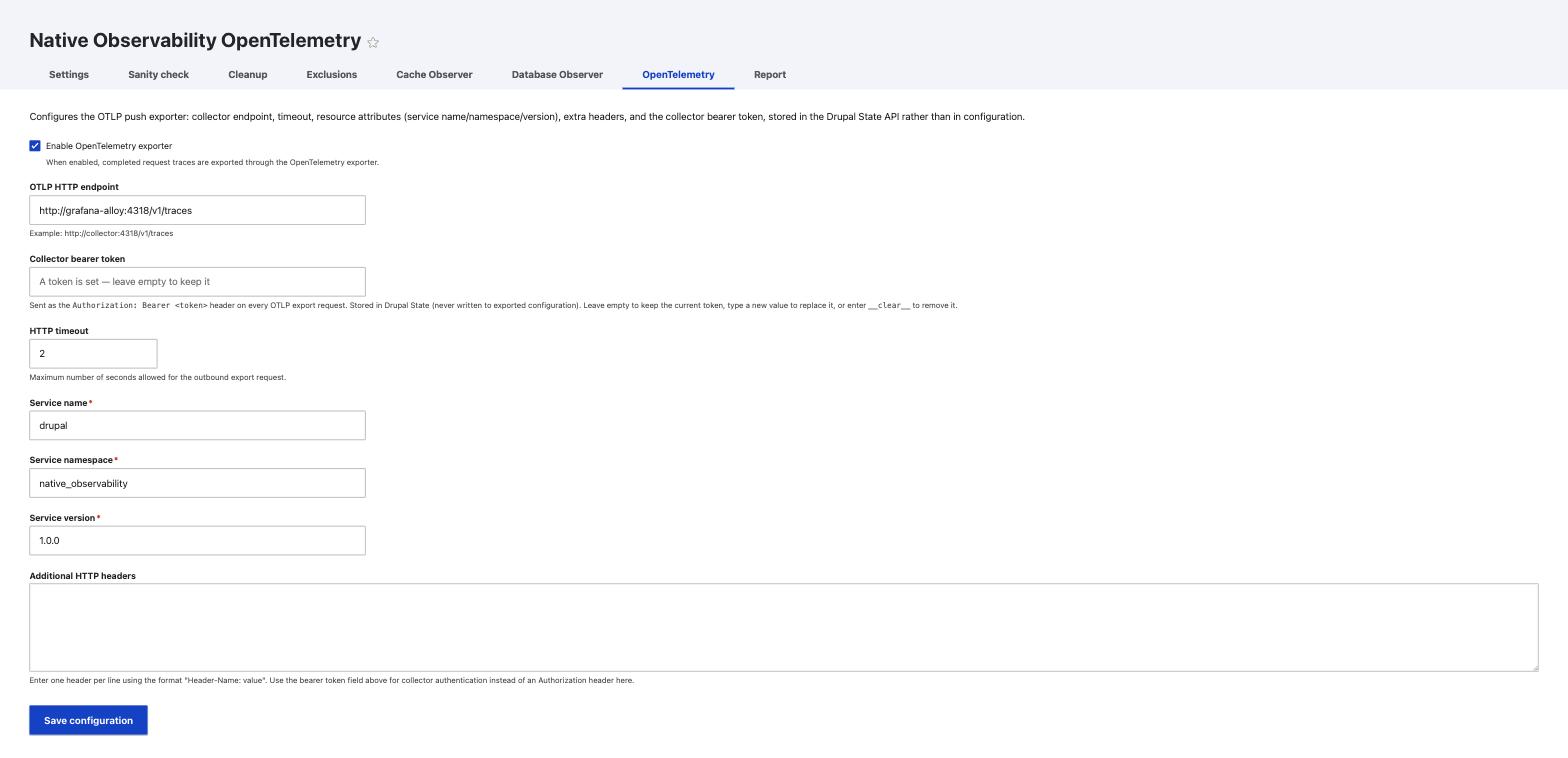
Form: native_observability_otel.settings at /admin/config/development/native-observability/settings/otel.
| Config key | Type | Default | Meaning |
|---|---|---|---|
enabled |
boolean | false |
Enable the OpenTelemetry (OTLP) push exporter. |
endpoint |
string | '' |
OTLP HTTP endpoint traces are pushed to. |
timeout |
float | 2.0 |
HTTP timeout, in seconds, for each export call. |
service_name |
string | drupal |
service.name resource attribute sent with every export. |
service_namespace |
string | native_observability |
service.namespace resource attribute sent with every export. |
service_version |
string | 1.0.0 |
service.version resource attribute sent with every export. |
headers |
sequence | {} |
Extra HTTP headers sent with every OTLP export request. |
The OTLP collector bearer token is stored in the Drupal State API, managed from this same form, drush no:token:generate otlp, or drush sset native_observability_otel.otlp_bearer_token.
Report settings
Form: native_observability_report.settings at /admin/config/development/native-observability/settings/report. Requires the administer site configuration permission.
| Config key | Type | Default | Meaning |
|---|---|---|---|
use_custom_narrative_file |
boolean | false |
Load report narrative text from a custom YAML file instead of the bundled one. |
custom_narrative_file_path |
string | '' |
Path to the custom narrative YAML file, used when use_custom_narrative_file is enabled. |
fallback_language |
string | en |
Language used when a narrative string is missing in the requested language. |
strict_fallback |
boolean | true |
Require strict language fallback handling instead of silently mixing languages. |
default_detail_level |
string | intermediate |
Default report detail level shown in the report builder. |
default_mask_user_identifiers |
boolean | true |
Mask user identifiers by default in generated reports. |
default_hide_ip_addresses |
boolean | true |
Hide IP addresses by default in generated reports. |
default_hide_route_parameters |
boolean | true |
Hide route parameters by default in generated reports. |
overhead.display |
string | hidden |
Publication state of the observability overhead section: hidden, manual (a value declared by the document author), or measured (the last value recorded by the overhead measurement command). See Observability overhead disclosure. |
overhead.manual_percent |
float, nullable | null |
Percentage shown when overhead.display is manual. Not a measurement: entered by whoever configures the report. |
overhead.manual_note |
string | '' |
Optional context shown alongside the manual value. |
overhead.include_in_document |
boolean | true |
Default value of the per-document "Include observability overhead" choice on the report builder form. Controls only whether the section is shown, independently of overhead.display. |
Export settings
Form: native_observability_export.settings at /admin/config/development/native-observability/settings/export.
| Config key | Type | Default | Meaning |
|---|---|---|---|
prometheus_window_seconds |
integer | 300 |
Rolling window, in seconds, used to compute the Prometheus metrics served at scrape time. |
prometheus_label_strategy |
string | route_only |
Which trace columns become Prometheus label dimensions. See the warning below: the machine names do not describe what they emit. |
| prometheus_max_series | integer | 5000 | Hard cap on label series per scrape. Beyond it the reader drops the lowest-count series and emits drupal_prometheus_truncated{reason="series_limit"} 1, so the truncation is visible in Grafana rather than silent. |
The bearer token is not configuration. It lives in Drupal State
(native_observability_export.secret.prometheus_bearer_token) and is never
written to exported configuration. Generate it with
drush native_observability:token:generate prometheus, set it on the form, or
submit __clear__ to remove it. The form renders a ready-to-copy
scrape_configs block underneath, prefilled with this site's URL.
The label strategy machine names contradict their labels
The stored values do not describe what they emit, and exported configuration shows the value, not the label:
| Stored value | What it actually emits |
|---|---|
route_only (default) |
route plus method plus status code |
route_and_method |
route plus method only |
route_path_method |
route plus path plus method plus status code |
Reading route_only in a config export and concluding that only the route
is a label dimension is the natural reading, and it is wrong. The default
is the middle option by cardinality, not the narrowest.
route_path_method is the legacy behaviour and carries a real risk: a site
with 5000 nodes emits 5000 or more series for node.canonical alone. Use
it on small sites or local development only.
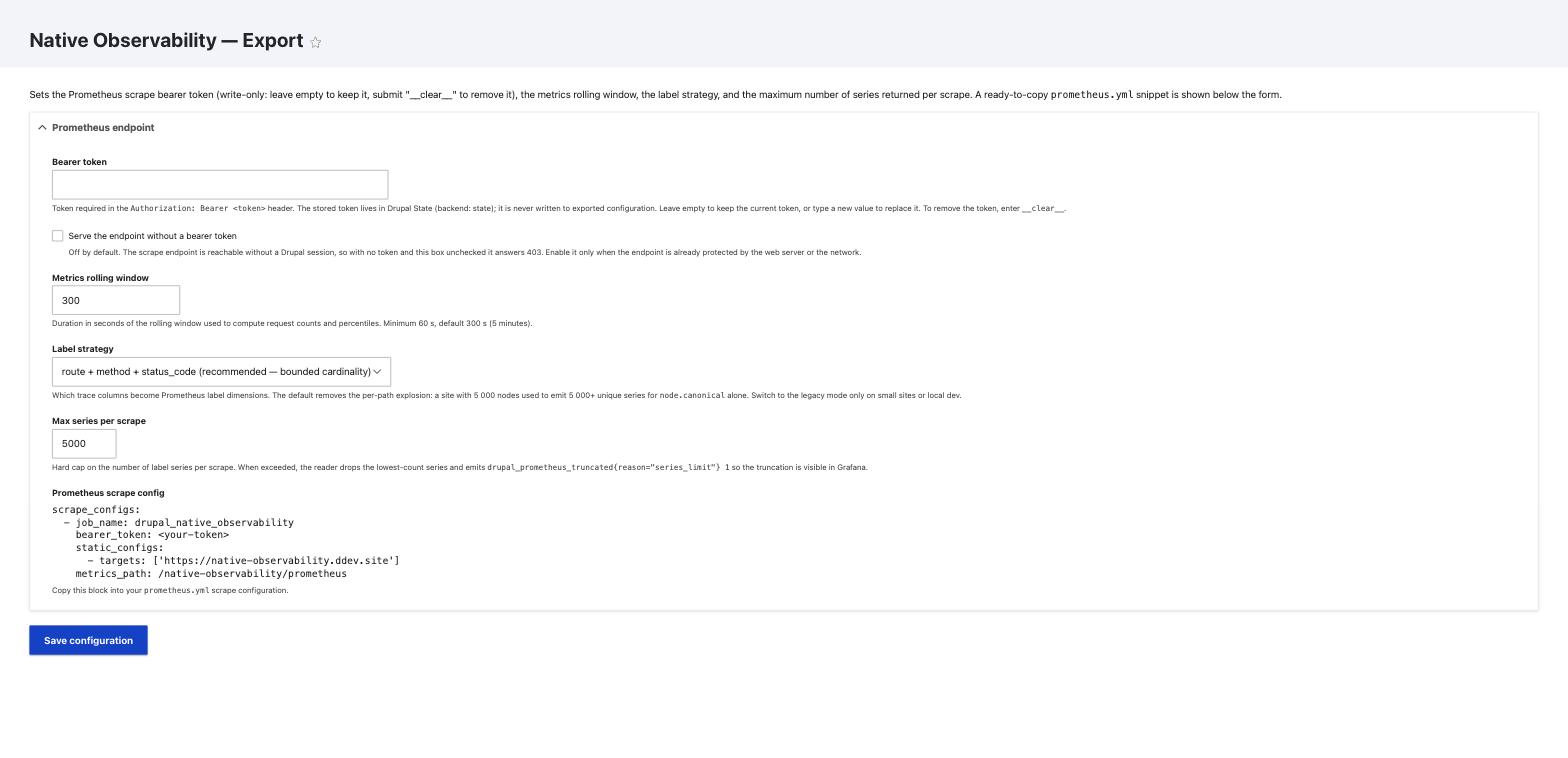
The Prometheus scrape bearer token is not part of this configuration object: it is stored in the Drupal State API and managed from this same form, drush no:token:generate prometheus, or drush sset native_observability_export.secret.prometheus_bearer_token.