Running the measurement and publishing it
This page is the walkthrough: how to run the overhead measurement, what every field on the form means, and what the report publishes afterwards.
Two neighbouring pages answer different questions. Measuring the overhead explains the protocol, so you can reproduce or contest a number. Overhead cost publishes the numbers measured on the development machine, with their parameters.
Nothing here is estimated. The report either publishes a value a human typed, a value this module measured on your server, or nothing at all, and it always says which of the three it is.
Every number on this page is an example, not a result you should expect
The tables, the terminal output and the screenshots below come from runs on one development laptop, with the database in Docker, all sub-modules installed, and the machine doing other things at the same time. They are here to show the shape of the output: which columns exist, how the rows are ordered, what the verdict changes. The figures themselves will be different on your server, and they differ between two runs on the same machine: the fixed cost measured here ranged from 4.59 to 5.72 ms across eight repeats of the identical command.
Read them as an illustration. The only figures that describe your installation are the ones your own run produces.
The three publication states
The report has exactly three states, and they are the whole model.
| state | what the report publishes | where the value comes from |
|---|---|---|
| Hidden | no overhead section at all | nothing is published |
| Declared by the document author | the percentage entered on the settings form | a human |
| Measured on this server | the last measurement stored by the command | drush no:overhead:measure --record=... |
The label above the value is not optional. There is no setting that prints a number without saying where it came from, and the document author cannot remove it. What the author can do is hide the section entirely, in the site defaults or for one document.
Step 1: run the measurement
From the command line
Prefer this one. A command-line run has the site to itself. A run started from the administrative interface happens while the site is serving real traffic, and that traffic adds variability the measurement cannot subtract.
drush no:overhead:measure
With no options it runs the full workload catalog, 7 measured pairs per workload, 15 requests per block for the HTTP workloads, plus the OFF/OFF control pass that establishes the noise floor. It prints a table and stores nothing.
To measure and publish in one step, name the workload whose row you want published:
drush no:overhead:measure --only=calibration-minimal,calibration-calibrated \
  --pairs=12 --requests=5 --record=calibration-minimal
--record is the only option that writes anything outside the run. It stores the named row and
switches the report to measured. Without it, nothing is published: there is no sensible default,
because the cost depends on which page you measured.
What it prints
The run above, on 17 September 2026, on the development machine described in Overhead cost:
Native Observability overhead matrix
====================================

Site path: sites/default | Drupal: 11.4.5
Source: cli | Site serving real traffic during this run: no
Pairs: 9 (plus one discarded warm-up pair) | Requests/block: 6 | Unit-requests/block: 500 |
Control pass: yes | Keep rows: no | Ledger: yes | Only: calibration-minimal,calibration-calibrated
page_cache installed: yes | dynamic_page_cache installed: yes
HTTP workload catalog: calibration-minimal -> /native-observability/calibration/minimal,
calibration-calibrated -> /native-observability/calibration/calibrated
native_observability_trace: 124 row(s) deleted (by request_id, plus id > 2779 for rows this run wrote without one).
native_observability_spans: 248 row(s) deleted (by request_id, plus id > 11898 for rows this run wrote without one).
native_observability_cache_event: 372 row(s) deleted (by request_id, plus id > 8708 for rows this run wrote without one).
native_observability_database_query: 0 row(s) deleted (by request_id, plus id > 0 for rows this run wrote without one).
native_observability_route_metric: 0 row(s) deleted (id > 0).

Headline figure
---------------

Fixed cost per request (a): 5.717 ms/req
Cost per unit of declared load (b): not resolved, the difference between the two routes' own
deltas is 'below-noise' ('unclear' in the table): delta 5.717 ms on calibration-minimal and
5.943 ms on calibration-calibrated, difference 0.225 ms over 20 unit(s), p = 1.00000, noise
floor 0.467 ms. This is a result, not a failure: it means the cost does not grow with the
declared load, as far as this run can resolve.

+------------------------+-----------+--------+-------+----------+---------+
| Workload               | OFF       | ON     | Delta | Delta %  | Verdict |
+------------------------+-----------+--------+-------+----------+---------+
| calibration-minimal    | 3.648 ms  | 9.331  | 5.717 | +156.72% | meas    |
| calibration-calibrated | 23.965 ms | 29.908 | 5.943 | +24.80%  | meas    |
+------------------------+-----------+--------+-------+----------+---------+

Per-workload detail
-------------------

  calibration-minimal:
    - throughput: 274.1 -> 107.2 /s (-60.9%)
    - latency (handle() only): OFF 3.075 | ON 8.277 | delta 5.251
    - deferred (after the response is sent, occupation minus latency): 1.055 (11.3% of ON occupation)
    - budget: 0.71% of the declared TTFB budget (good)
    - reconciliation: total 5.717ms = census 5.057ms + induced 0.000ms + residual 0.660ms
    - N 6 | IQR [5.540, 5.802] | noise 0.171 | signs 9/9 | p=0.00391 | rows off/on 0/324 | rows/req 6.000
Three things in that output are its own evidence rather than its conclusion.
signs 9/9 | p=0.00391 says every one of the nine paired differences had the same sign, and that
an exact two-sided sign test puts the odds of that happening by chance at about one in 256.
noise 0.171 is the OFF/OFF control pass: with capture off on both sides, this machine still
moved by 0.171 ms, and a delta of 5.717 ms is thirty-three times that. rows off/on 0/324 proves
the two states really differed: the OFF blocks wrote nothing, the ON blocks wrote 324 rows.
The second row answers "does it get worse on a heavier page". The calibrated route runs 20
declared units of extra work and costs 5.943 ms against the minimal route's 5.717 ms. The
0.225 ms difference over 20 units does not clear this run's noise floor, so b stays unresolved:
as far as this run can see, the cost does not grow with the page's declared load. That is a
result, not a failed measurement, and the command says so instead of rounding it to a small
positive number.
Where the time goes inside a request
Pass --ledger and the run adds a timeline: for every instrumented point, when it fired, which
sub-module owns it, and how long this module spent there.
    - request timeline (ledger, median per unit):
        Name                  | ClassName                          | Module              | Request  | Native Observability
        request start         |                                    | -                   | 0.000 ms | -
        db.log_start          | DatabaseQueryObserverSubscriber    | database_observer** | 0.108 ms | 0.002 ms
        trace.request         | TraceSubscriber                    | base                | 0.171 ms | 0.000 ms
        execution.request     | ExecutionRequestSubscriber         | execution**         | 2.824 ms | 0.000 ms
        db.classify           | DatabaseQueryObserverSubscriber    | database_observer** | 2.938 ms | 0.016 ms
        execution.response    | ExecutionRequestSubscriber         | execution**         | 3.019 ms | 1.539 ms
        cache.response        | CacheResponseObserverSubscriber    | cache_observer**    | 4.618 ms | 0.339 ms
        span.request_summary  | RequestSummarySpanSubscriber       | spans**             | 4.946 ms | 0.040 ms
        span.database_summary | DatabaseSummarySpanSubscriber      | spans**             | 4.988 ms | 0.013 ms
        trace.response        | TraceSubscriber                    | base                | 5.277 ms | 0.724 ms
        cache.invalidate      | ObservedCacheTagsInvalidator       | cache_observer**    | 5.681 ms | 0.313 ms
        otel.response         | OpenTelemetryTraceSubscriber       | otel*               | 6.286 ms | 0.022 ms
        span.trace_link       | SpanTraceLinkSubscriber            | spans**             | 6.315 ms | 0.856 ms
        cache.page            | CachePageObserverMiddleware        | cache_observer**    | 7.500 ms | 0.738 ms
        response sent         |                                    | -                   | 8.277 ms | -
        terminate.flush       | DeferredPersistenceFlushSubscriber | base                | 8.295 ms | 0.453 ms
        Total                 |                                    |                     | 9.331 ms | 5.057 ms
        optional sub-modules account for 3.880 ms of 5.057 ms: cache_observer, database_observer, execution, spans, otel
        not reached during this run
          trace.exception | TraceSubscriber       | base        | - | -  (reached only when the request throws)
          http.span       | GuzzleSpanMiddleware  | spans**     | - | -  (reached only when the request makes an outbound HTTP call)
          http.trace      | GuzzleTraceMiddleware | execution** | - | -  (reached only when the request makes an outbound HTTP call)
| column | what it holds |
|---|---|
| Name | The cost-ledger key, declared in the integration-point manifest. |
| ClassName | The class that owns that key. |
| Module | The sub-module that owns it, or base for the module everything depends on. |
| Request | When it fired, measured from the start of the request. |
| Native Observability | How long this module spent there, on that one point. |
Rows are sorted by the moment they happened, so the table reads top to bottom. request start and
response sent are not instrumented points: they are the two anchors that tell you which work the
visitor waits for and which happens afterwards.
The moments above are this machine's, on one run. On your server the points fire in the same order for the same reasons, and at different times.
What the marks mean
* is a sub-module you can uninstall on its own. ** is one that something else installed depends
on, so uninstalling it uninstalls that too. The legend spells out which, computed for your site:
Only otel can be uninstalled on its own; removing cache_observer or spans also removes dashboard,
export and report; removing database_observer or execution also removes dashboard and report.
On a different installation that sentence says something different, because it reads that site's own dependency graph. It is the answer to "what do I actually lose", which the cost alone never gives you.
The table also states its own scope, because it lists what costs, not what is removable:
This table lists the sub-modules that cost something on a request; also installed and removable
without appearing here: dashboard, export, metrics, report, status_block.
Those five instrument nothing on a request, so their cost there really is zero. They are named so that a reader deciding what to uninstall is not misled by their absence.
Rows with no figures
Two things produce an empty cell, and only one of them can be filled.
When a run had the ledger switched off there is no timeline at all, and the administrative page says so where the table would have been, rather than showing nothing.
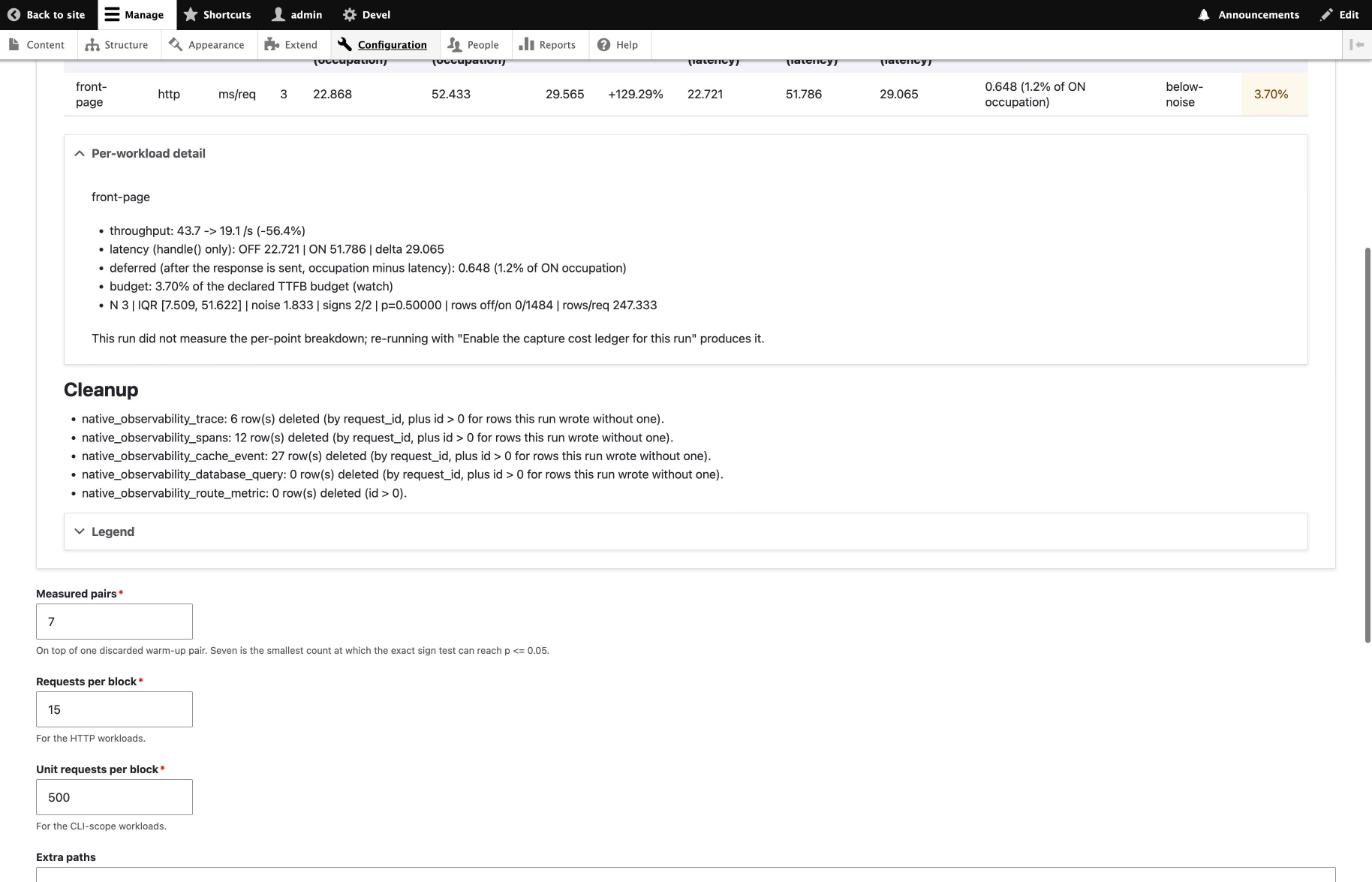
The not reached during this run rows were never crossed, and each says what would cross it.
http.span and http.trace need a request that makes an outbound HTTP call: run the
outbound-call workload, or point --path (the "Extra paths" field, from the administrative page)
at a page of yours that calls an external service. trace.exception needs a request that throws.
The n/a in the latency and deferred columns of the cli workloads is different: no option fills
it, because a CLI unit never calls terminate() separately from itself. There is nothing to run.
Three things this table shows and no aggregate figure can
Where the cost concentrates. execution.response is 1.539 ms of the 5.057 ms total, about a
third of it, on one point.
What falls after the response. response sent is at 8.277 ms and terminate.flush at 8.295 ms,
so its 0.453 ms of database writes are paid after the visitor already has the page.
A point that fires later than its position suggests. cache.page belongs to an HTTP middleware,
which wraps everything, yet it appears at 7.500 ms. That is correct: CachePageObserverMiddleware
starts its measurement after the delegate kernel call, so it times only its own post-processing, on
the way back out. Sorting by the measured moment puts it where it really happened.
The two value columns do not add up to each other, and that is not an error: between
execution.response at 3.019 ms and cache.response at 4.618 ms the request spends about 1.6 ms
inside Drupal core, where this module does nothing. The Native Observability column also
double-counts nested points, because the ledger accumulates inclusive time. The figure that does
reconcile is on the reconciliation: line of the same output.
When the run could not resolve its own delta
A row whose verdict is not measurable does not print the quantities derived from its delta: the
query equivalent and the throughput comparison are replaced by one line saying why, and what would
change it.
- throughput: suppressed, because this row's delta could not be distinguished from its own noise,
  and this run had no control pass to measure a noise floor against. More pairs, or a control pass,
  would change that.
The absolute OFF, ON and delta stay, with the verdict beside them. What goes is every restatement of an unresolved number in another unit, because each restatement reads as one more independent finding. A negative query equivalent is never printed at all, on any row: a count of queries does not admit a negative.
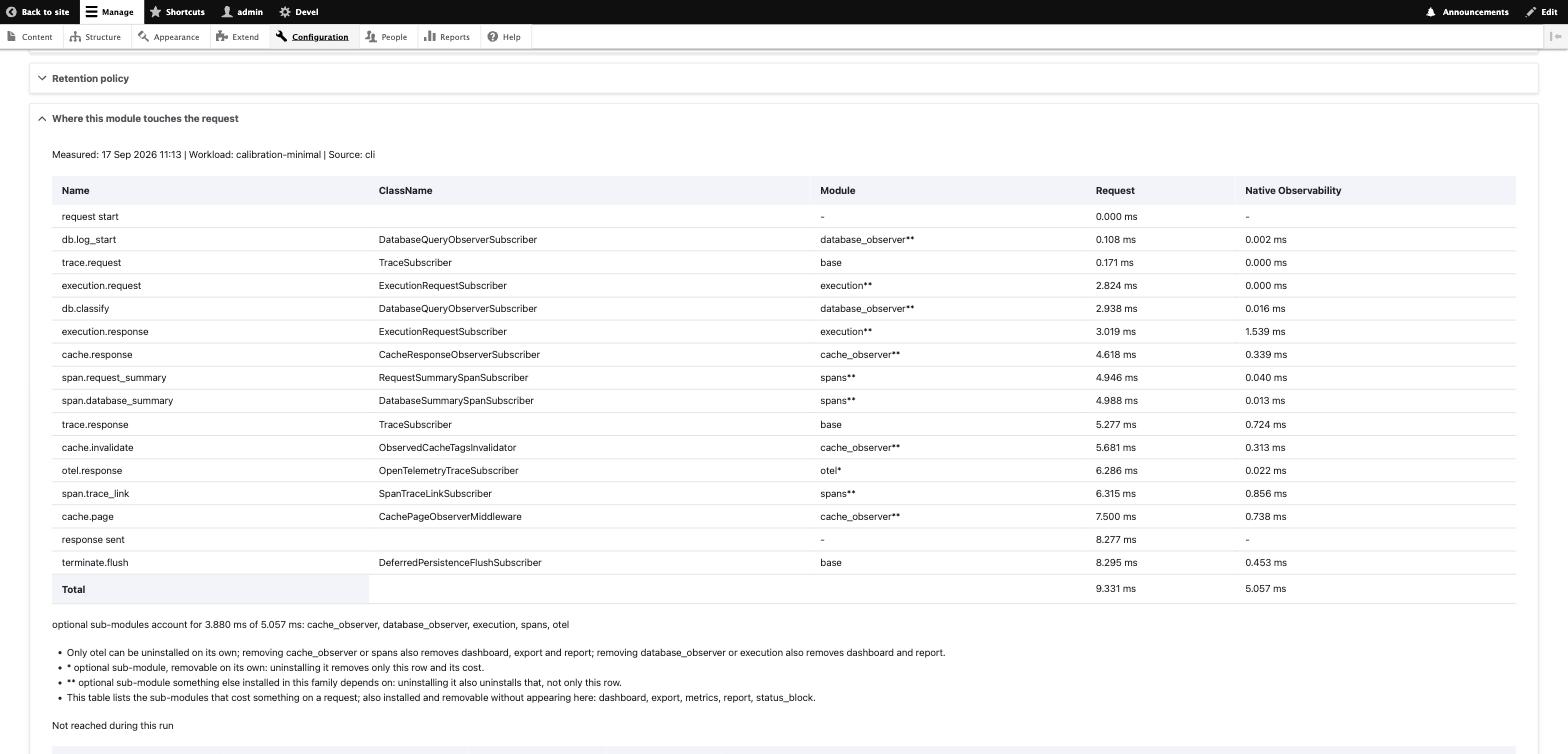
The same table appears on the overhead measurement page, and on the module's settings page under Where this module touches the request, where it is built from the manifest even before anything has been measured.
Step 3: choose what the report publishes
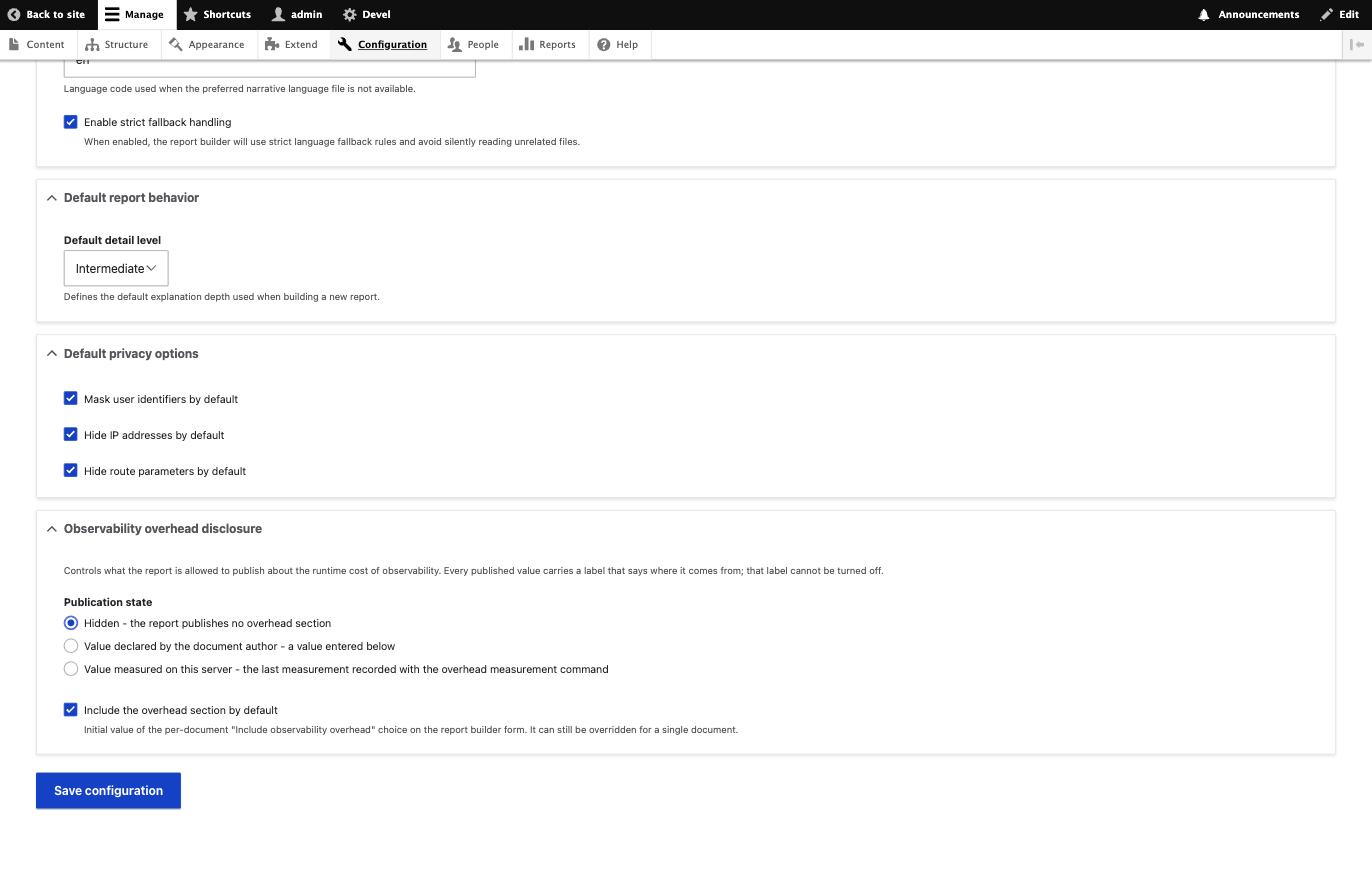
Go to Configuration > Development > Native Observability > Report, section Observability overhead disclosure.
Hidden
The default, and the state to leave it in when you have not measured anything. The report publishes no overhead section.
Value declared by the document author
Choosing it reveals two fields.
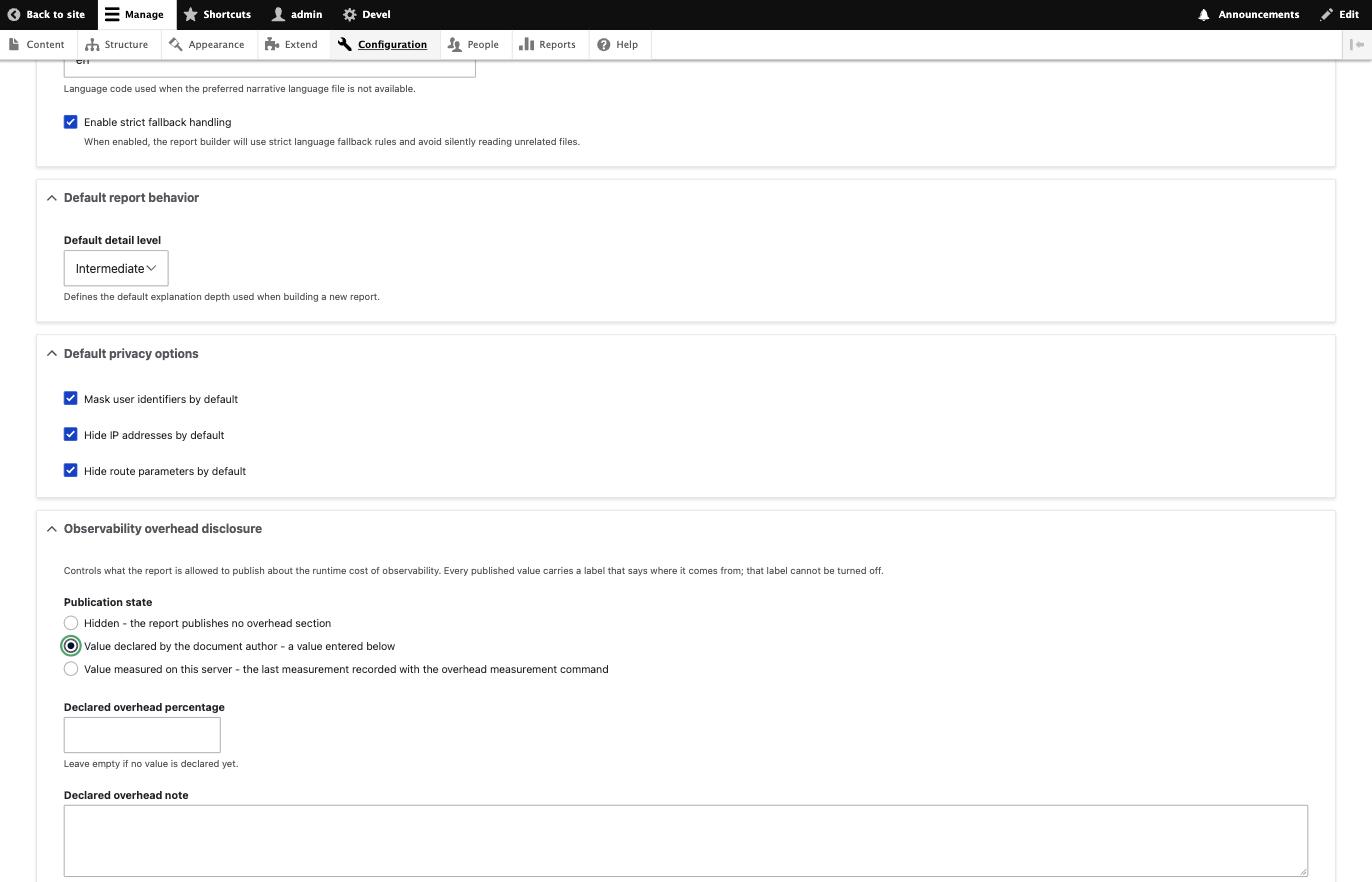
| field | what it is for |
|---|---|
| Declared overhead percentage | The number the report prints. Nothing validates it against reality; it is your claim. |
| Declared overhead note | Free text printed under the value. Use it to say where your figure comes from. |
Use this state when the measurement was taken somewhere else, on staging or on a machine that is not the one serving the report. The label tells the reader where the figure came from.
Value measured on this server
Available once a measurement has been stored with --record. If the state is selected and no
measurement is stored, the settings form warns you, and the report degrades to publishing nothing
rather than printing a stale or malformed value.
Include the overhead section by default
This is the initial value of the per-document choice, not a fourth state. It decides whether a new report includes the section; the author can still override it for a single document.
Step 4: what lands in the report
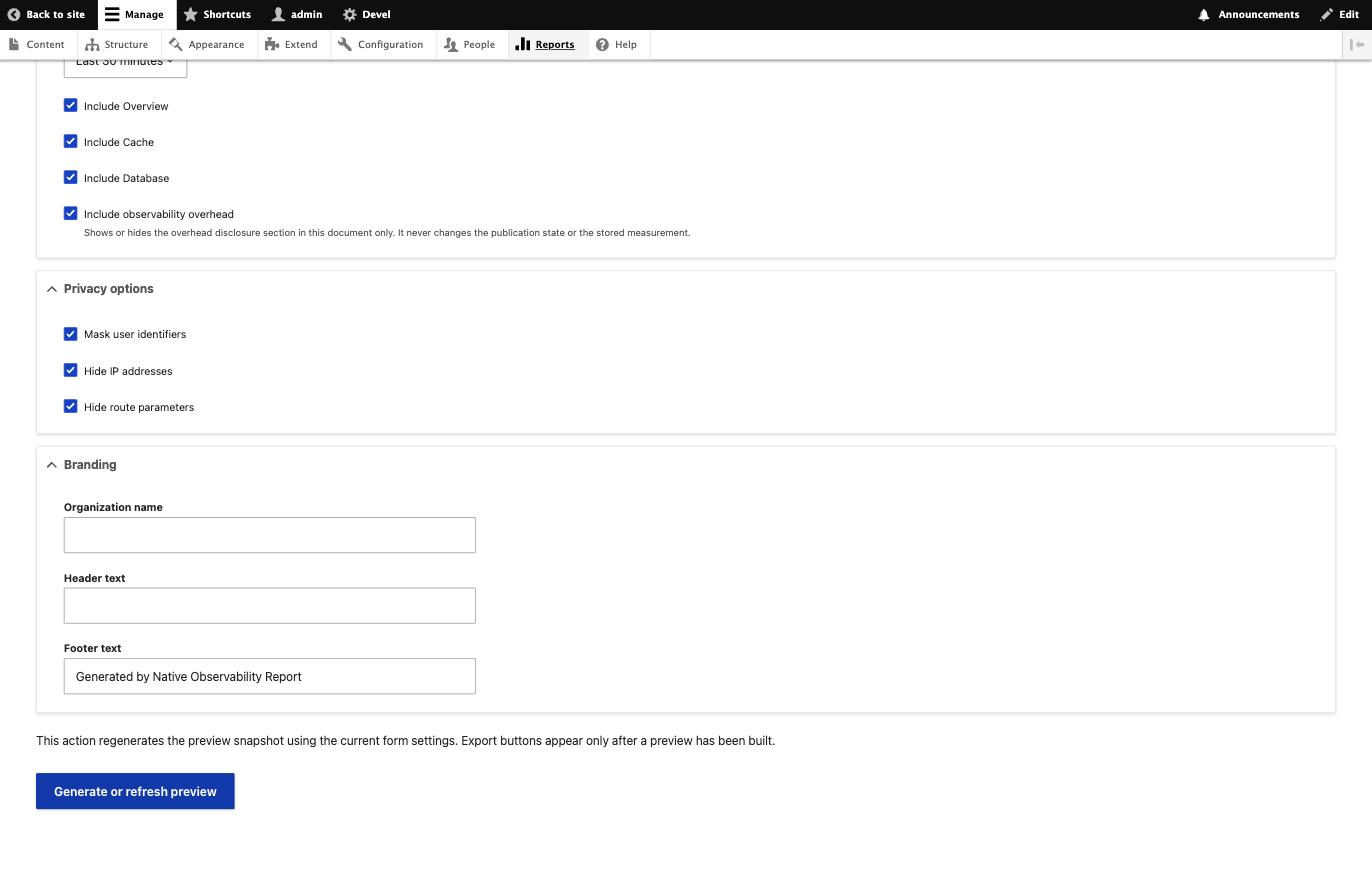
On the report builder, at Reports > Native Observability > Observability Report, the checkbox Include observability overhead hides or shows the section in that one document. It never changes the publication state and never touches the stored measurement.
The declared state
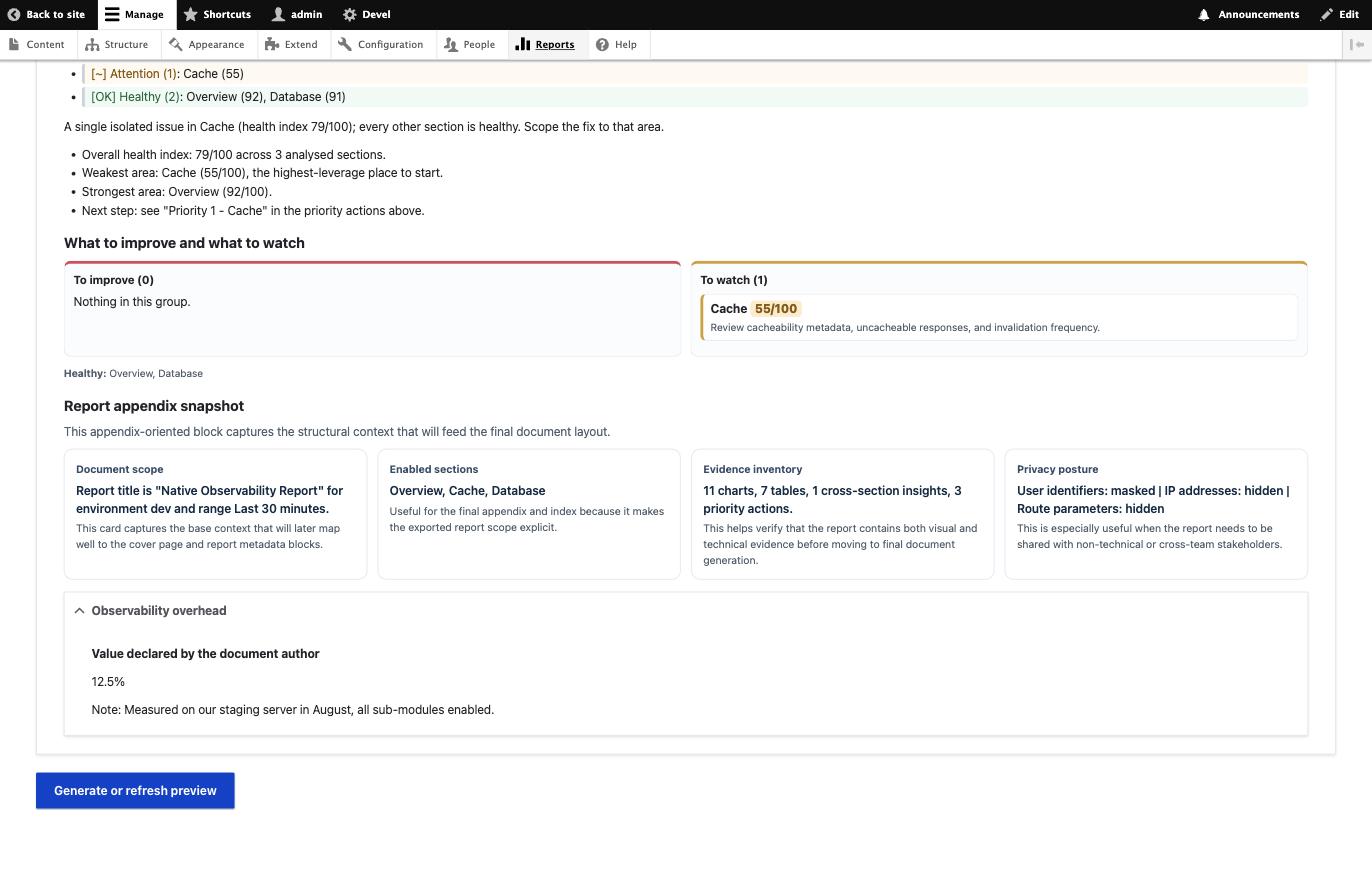
The label, the value, and the note. Nothing else, because there is nothing else to say about a number a human typed.
The measured state
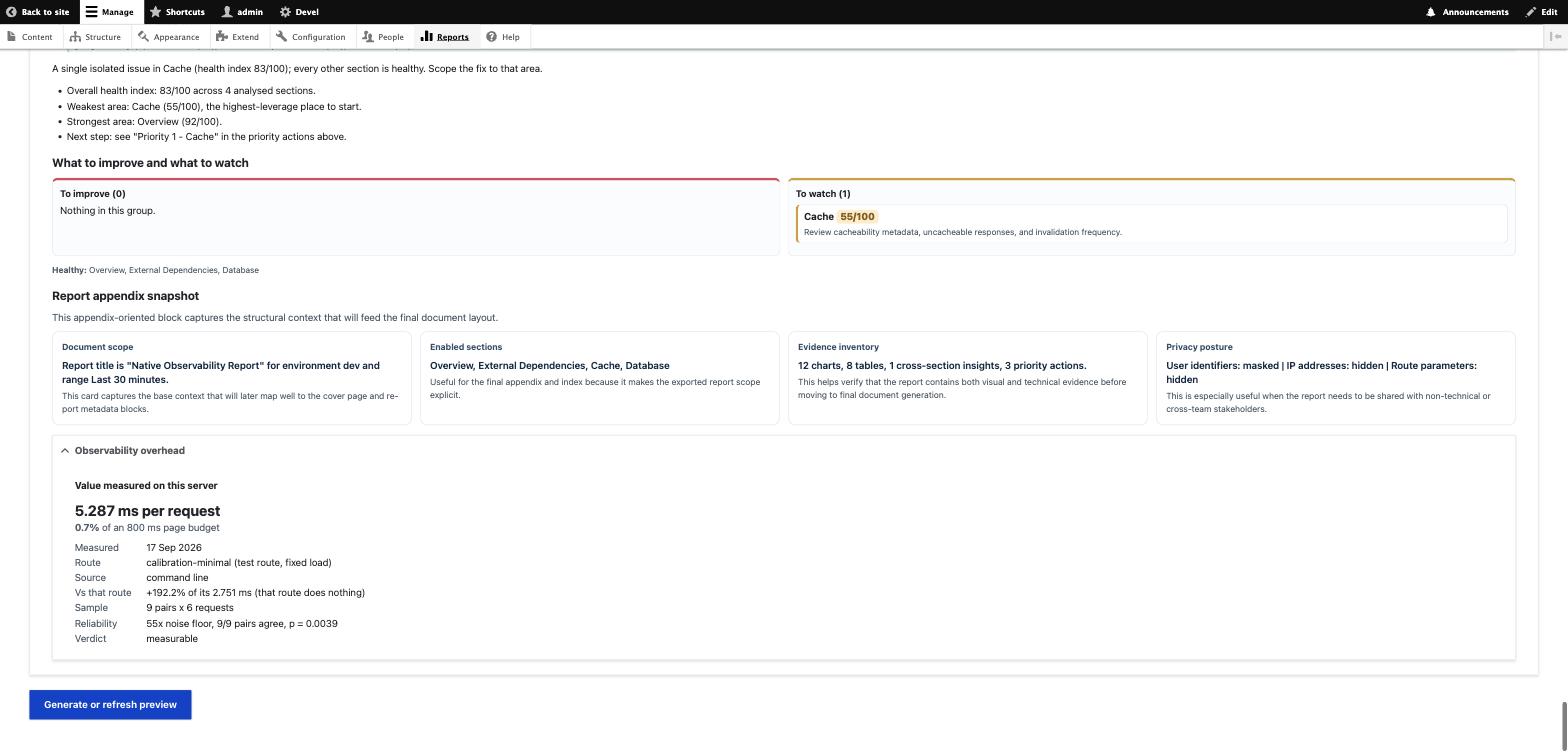
Two figures, then six facts.
5.287 ms per request
0.7% of an 800 ms page budget

  Measured        17 Sep 2026
  Route           calibration-minimal (test route, fixed load)
  Source          command line
  Vs that route   +192.2% of its 2.751 ms (that route does nothing)
  Sample          9 pairs x 6 requests
  Reliability     55x noise floor, 9/9 pairs agree, p = 0.0039
  Verdict         measurable
The first figure is the absolute difference in the unit it was measured in, never a percentage. The unit is not converted: a workload measured in microseconds per call is published in microseconds per call.
The second is the only percentage printed in bold, because it is the only one that stands on its
own: the same difference as a share of the page budget in
native_observability.settings:overhead.budget_ms, 800 ms by default.
| line | what it is for |
|---|---|
| Measured | The date. The report never decides whether a measurement has gone stale; it reports when it was taken. |
| Route | What was measured. A calibration route says so, a real page says so, and a workload measured outside a request says so. |
| Source | Where the run came from. A measurement taken from the administrative page ran while the site was serving real traffic, which is noisier than a command-line run with the site to itself, and the report says which it was rather than leaving it to be guessed. A payload recorded before this field existed prints no Source line at all, instead of a guessed one. |
| Vs that route | The percentage, next to the baseline it was computed on. Omitted entirely when there is no baseline to name. |
| Sample | How many pairs, of how many requests each. |
| Reliability | How many times larger the difference is than the noise floor, how many pairs agreed, the p-value. Each fragment is dropped when the measurement does not carry it. |
| Verdict | measurable, or below-noise (not distinguishable from this run's own noise). |
Why the percentage is not the headline. On calibration-minimal the baseline is 2.751 ms,
because that route is built to do nothing, so a 5.287 ms difference against it reads as +192.2%.
The arithmetic is right and the meaning is wrong: the percentage measures how empty the route is.
It stays in the block, in plain weight, next to its own denominator, and the parenthetical says
why it is large. That parenthetical only appears for the calibration routes, where it is true.
Measuring what one sub-module costs
The same command answers "what would I save by removing this part". Measure once with everything installed, uninstall the sub-modules you are considering, measure again with identical parameters, and compare the two fixed costs.
drush no:overhead:measure --only=calibration-minimal,calibration-calibrated --pairs=9 --requests=6
drush pm:uninstall native_observability_execution native_observability_spans
drush no:overhead:measure --only=calibration-minimal,calibration-calibrated --pairs=9 --requests=6
Use calibration-minimal for this, not a real page: its load is fixed and declared, so the only
thing that changed between the two runs is the set of installed sub-modules.
Two cautions. Uninstalling a sub-module drops its tables, so do this on an environment whose data you can lose. And check what else comes with it: Drupal uninstalls the modules that depend on the ones you named, and their cost, or their lack of it, is in your second number too.
Overhead cost publishes the result of exactly this comparison on the development machine, for Execution and Spans.
Removing what was published
drush no:overhead:clear
Deletes the stored measurement and sets the report back to hidden. The declared percentage and
its note are configuration and are not touched.
What a measurement leaves behind
The ON blocks write real observability rows, because that is what is being measured. When the run ends, the command deletes the rows it wrote, matching them by the request identifier of its own requests, and reports the count per table.
Rows that were already there are not touched. There is no option that widens the deletion beyond the run's own identity, so the command cannot remove someone else's data even if you ask it to.
Pass --keep-rows when you want to inspect what a run captured. You then own the cleanup, and
this is where the one real risk lives: emptying the tables by hand, with TRUNCATE or a bare
DELETE, removes every row in them, not only the ones your run wrote. On a shared or staging
database that is somebody else's captured traffic. Delete by the run's own request_id values, or
re-run the measurement without --keep-rows and let the command do it.