Dashboard
The native_observability_dashboard submodule provides the operational dashboard. It is installed by the DASHBOARD preset (drush no:preset:dashboard), which also enables native_observability_execution, native_observability_database_observer, native_observability_report, and native_observability_status_block.
Routes
| Route | Path | Permission |
|---|---|---|
native_observability_dashboard.overview |
/admin/reports/native-observability/dashboard |
access native observability dashboard |
native_observability_dashboard.cache |
/admin/reports/native-observability/dashboard/cache |
access native observability dashboard |
native_observability_dashboard.database |
/admin/reports/native-observability/dashboard/database |
access native observability dashboard |
native_observability_dashboard.forensic_route_analysis |
/admin/reports/native-observability/dashboard/forensic-route-analysis |
access native observability dashboard |
native_observability_dashboard.forensic_route_analysis_export_html |
/admin/reports/native-observability/dashboard/forensic-route-analysis/export/html |
access native observability dashboard |
native_observability_dashboard.export |
/admin/reports/native-observability/export/{dataset} |
administer site configuration |
native_observability_dashboard.flush |
/admin/reports/native-observability/flush/{dataset} |
administer site configuration |
native_observability_dashboard.cache_runtime_records_export |
/admin/reports/native-observability/dashboard/cache/export/runtime-records |
access native observability dashboard |
native_observability_dashboard.cache_route_bound_records_export |
/admin/reports/native-observability/dashboard/cache/export/route-bound-records |
access native observability dashboard |
The export and flush routes require administer site configuration, a stricter permission than the tab routes. Grant it only to roles that should manage the underlying explorer cache, not to every dashboard viewer.
Tabs
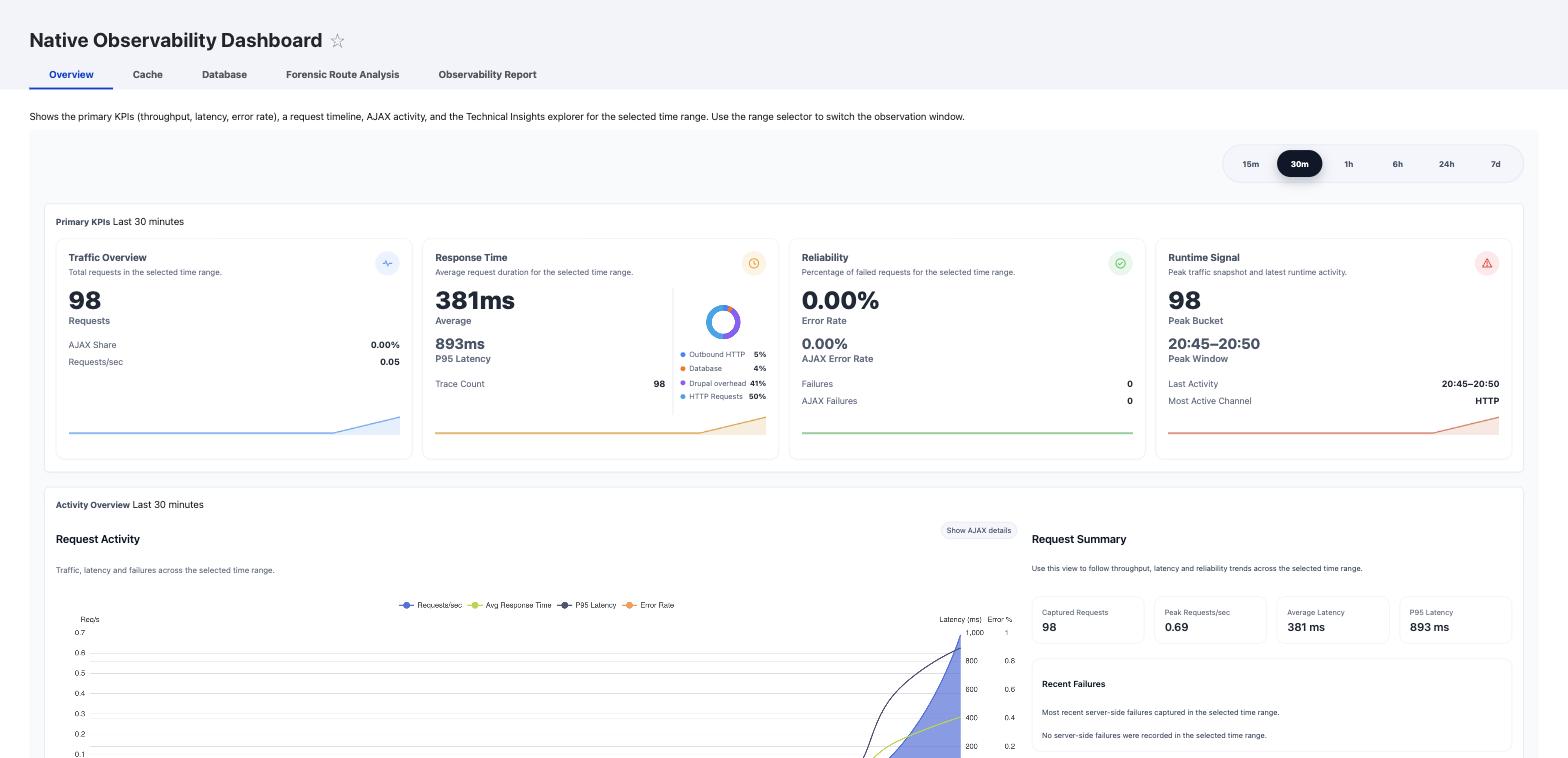
The dashboard is built around OverviewController, CacheController, DatabaseController, and ForensicRouteAnalysisController. Each controller resolves a time range and delegates rendering to a dedicated builder service.
- Overview (
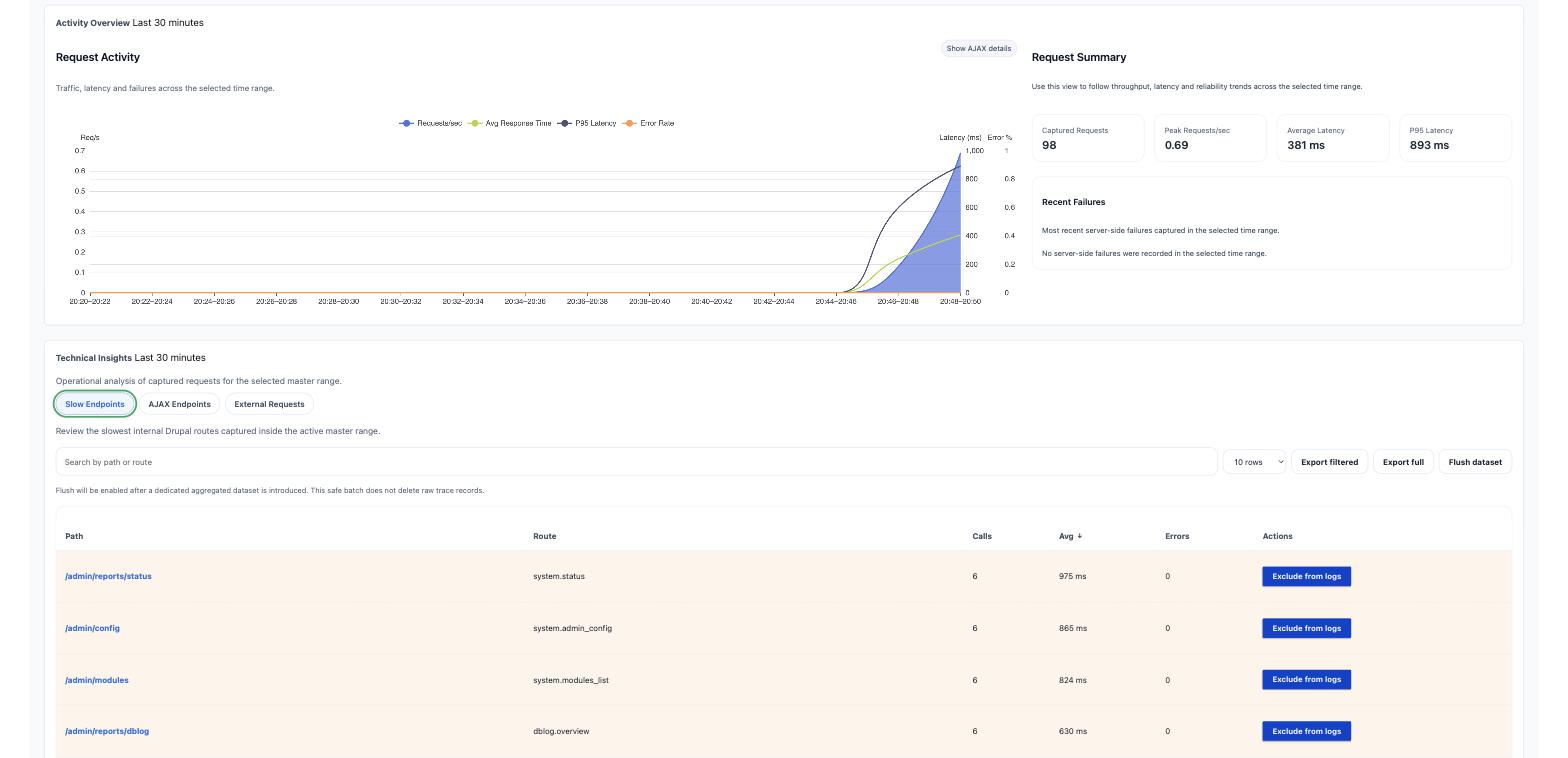
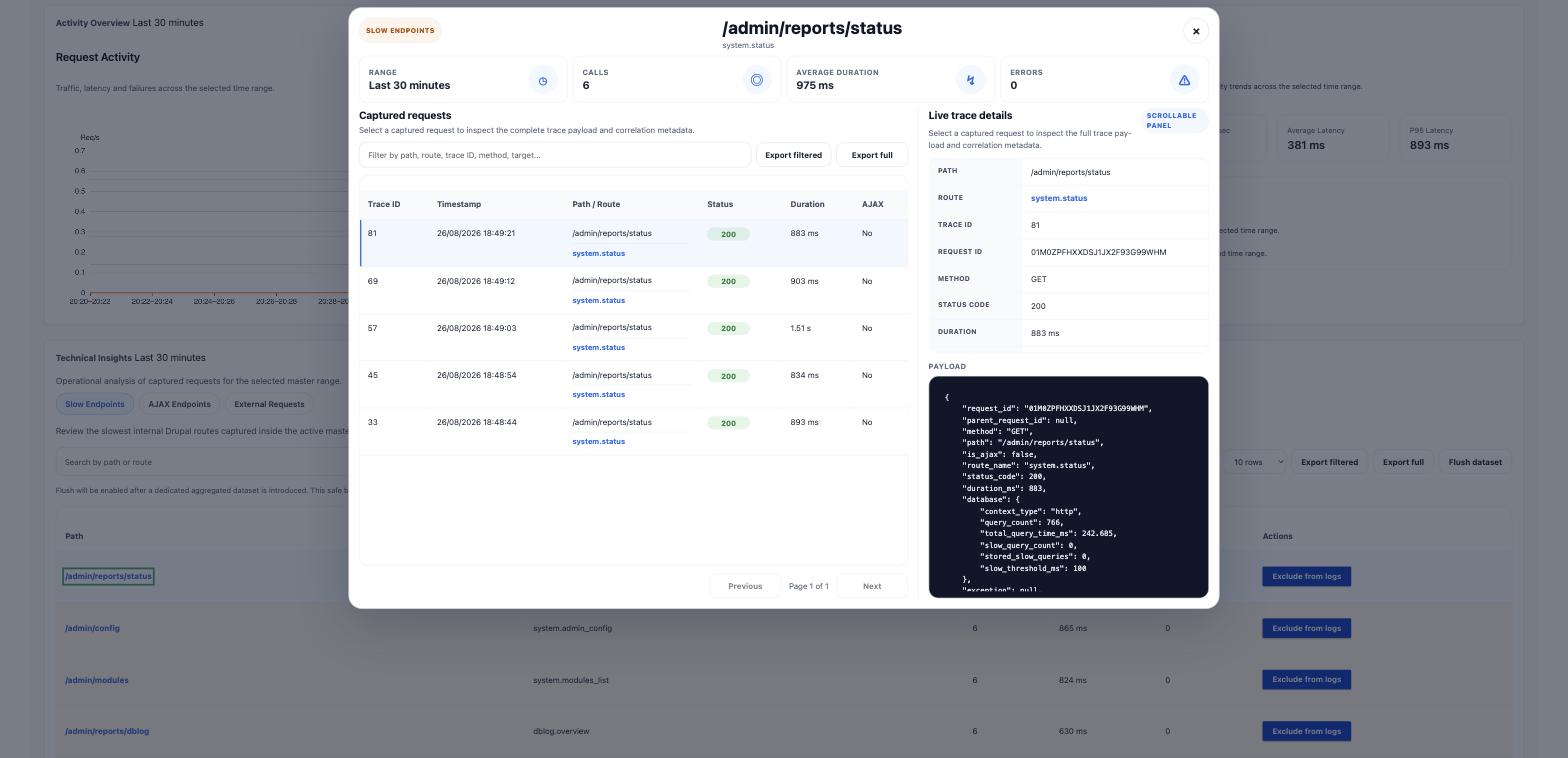
OverviewController). Primary KPI cards, the request timeline, AJAX activity, a response time breakdown donut, and the Technical Insights explorer (slow endpoints, AJAX endpoints, external requests). The donut covers every span in the window, which includes spans recorded outside a web request, such as outbound calls made by cron or drush. - Cache (
CacheController). Cache observability charts and two record tables: runtime (orphan) events with no active HTTP route, and route-bound events captured inside a routed request. - Database (
DatabaseController). Database pressure trend and request comparison charts, built fromDashboardDatabaseBuilder. - Forensic Route Analysis (
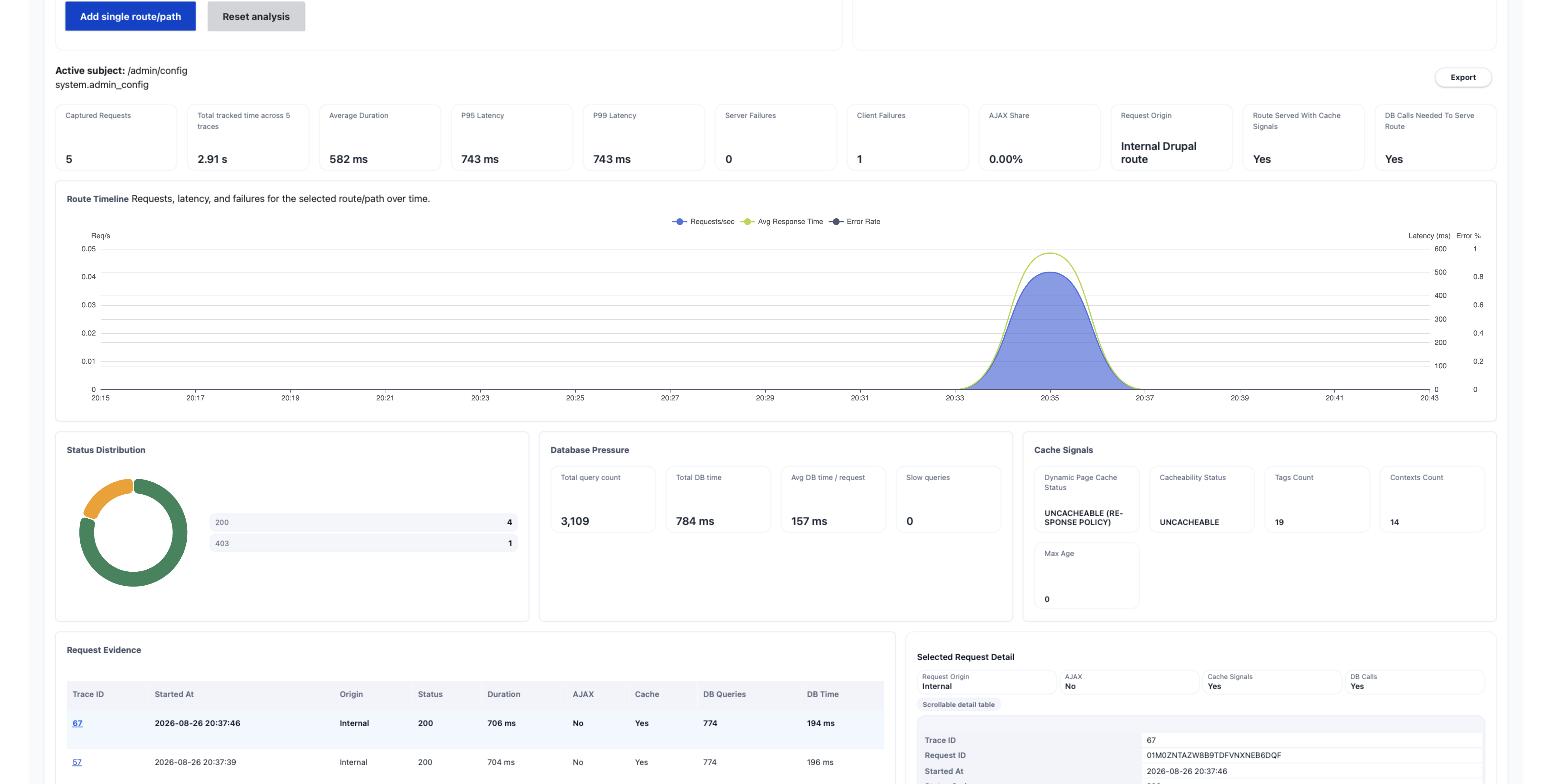
ForensicRouteAnalysisController). Cross-references traces, spans, and cache/database events for a selected route or trace. Supports a free-text search (q), subject filters (subjects[]), paginated evidence (evidence_page), paginated external dependencies (external_dependency_page), and an AJAX trace detail view (trace_id).
Range selection
Every tab shares DashboardTimeRangeResolver. The active range is read from the range query argument and validated against a fixed set of keys: 15m, 30m, 1h, 6h, 24h, 7d. An unknown or missing value falls back to the resolver default. The range selector rebuilds the current route with each key so switching ranges preserves the active tab and any other query arguments (search term, subjects, pagination).
flowchart LR
    A[Request with ?range=key] --> B{Key in allowed set?}
    B -- yes --> C[Use requested range]
    B -- no / missing --> D[Use default range]
    C --> E[Resolve start/end timestamps]
    D --> E
    E --> F[Builder service renders the tab]
Technical Insights export and flush
The Overview tab's Technical Insights explorer exposes three datasets: slow_endpoints (legacy alias slow), ajax_endpoints (legacy alias ajax), and external_requests (legacy alias external).
- Export (
TechnicalInsightsController::export) streams the dataset as CSV for the currently resolved range.external_requestsexportstarget,method,calls,avg,errors; the other datasets exportpath,route,calls,avg,errors. An empty dataset returns204 No Content. The download is namednative-observability-<dataset>-<range>-<YYYYMMDD-HHMMSS>.csv. - Flush (
TechnicalInsightsController::flush) invalidates the cache tagsnative_observability_dashboard,native_observability_dashboard:technical_insights, andnative_observability_dashboard:<dataset>. It never deletes raw trace or span records; it only clears the dashboard-level render cache for that dataset.
Cache CSV exports
CacheController::exportRuntimeRecords and CacheController::exportRouteBoundRecords export the two cache record tables shown on the Cache tab, independently of the Technical Insights datasets above:
| Export route | Rows | Filename |
|---|---|---|
cache_runtime_records_export |
Cache events with no active HTTP route (orphan) | native-observability-cache-orphan-records-<YYYYMMDD-HHMMSS>.csv |
cache_route_bound_records_export |
Cache events captured inside a routed request | native-observability-cache-route-bound-records-<YYYYMMDD-HHMMSS>.csv |
Both exports share the same CSV columns: time, event_type, cache_layer, method, context, status. The timestamp in the filename is the request time, so exporting the same table twice does not overwrite the earlier file.
The cache and database observer settings that feed these tabs are documented in Configuration and Configuration.